This is the weekly update of the Group and SOXM(SOX) tables in terms of earnings estimates and price changes.
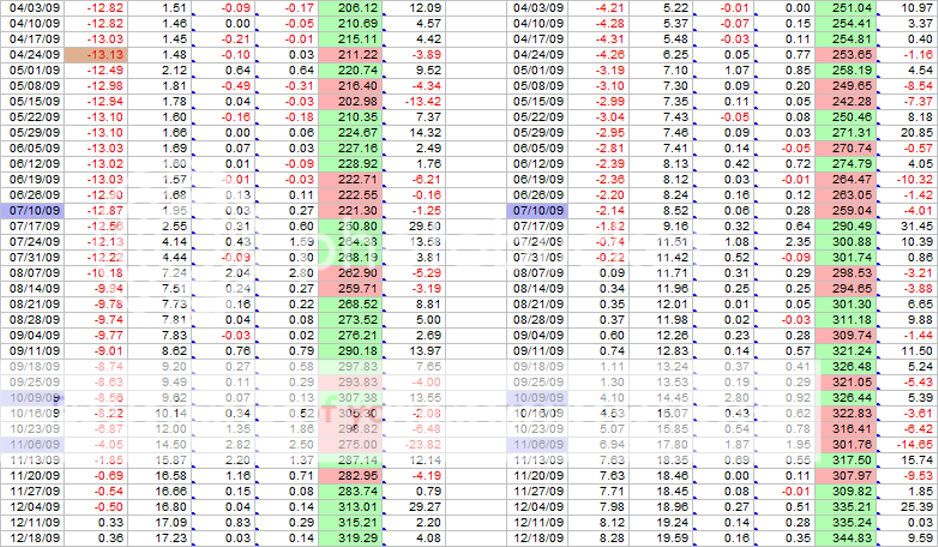
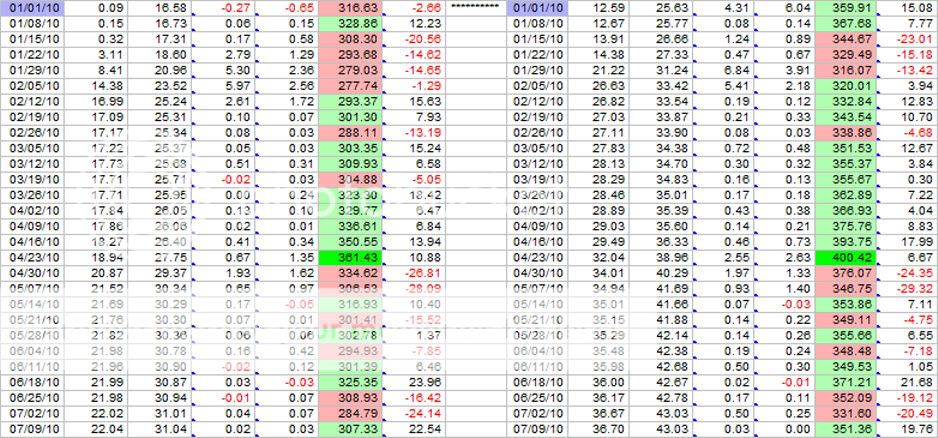
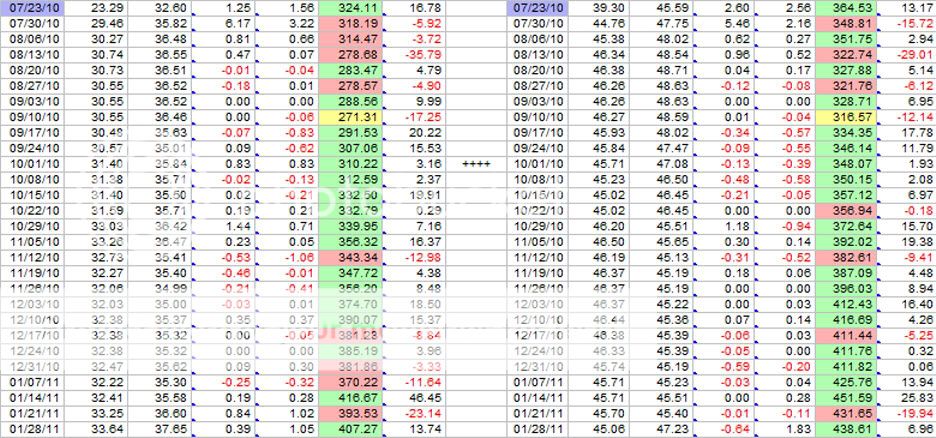
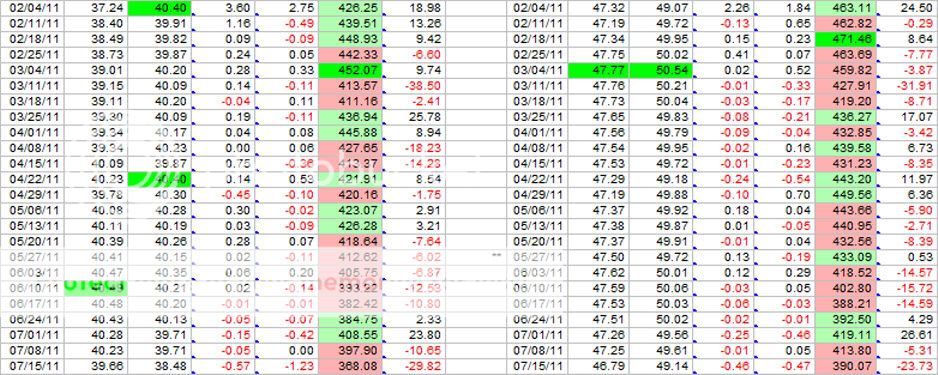
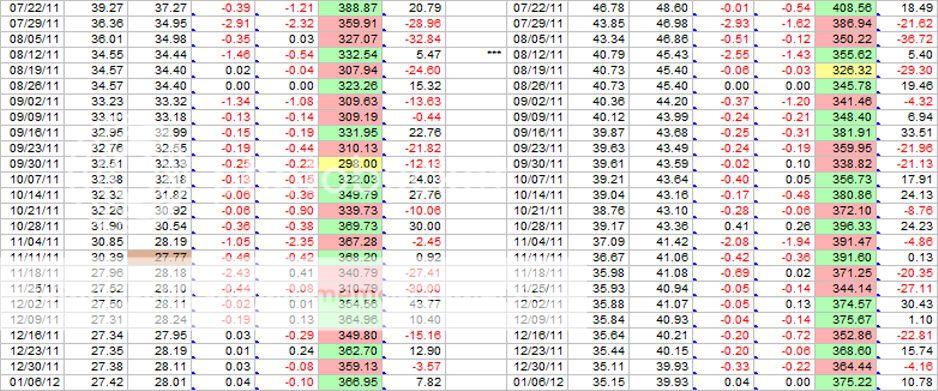
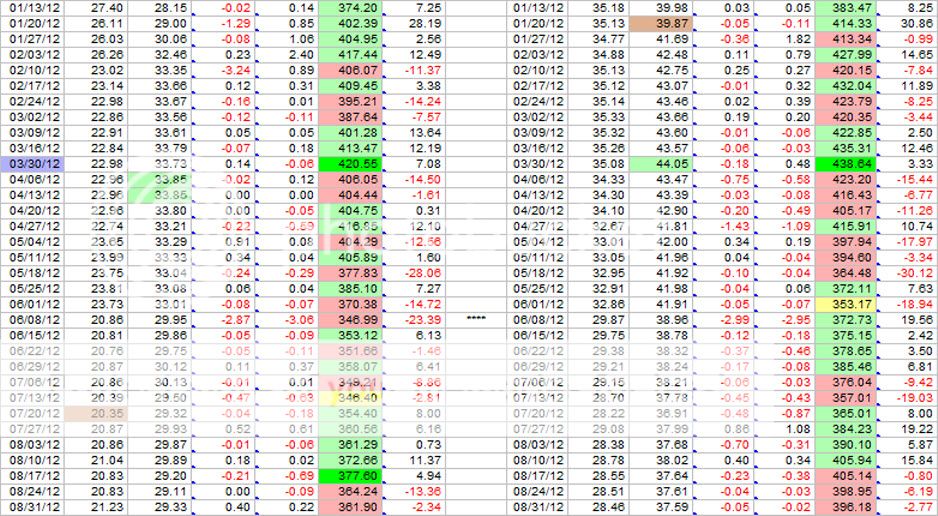
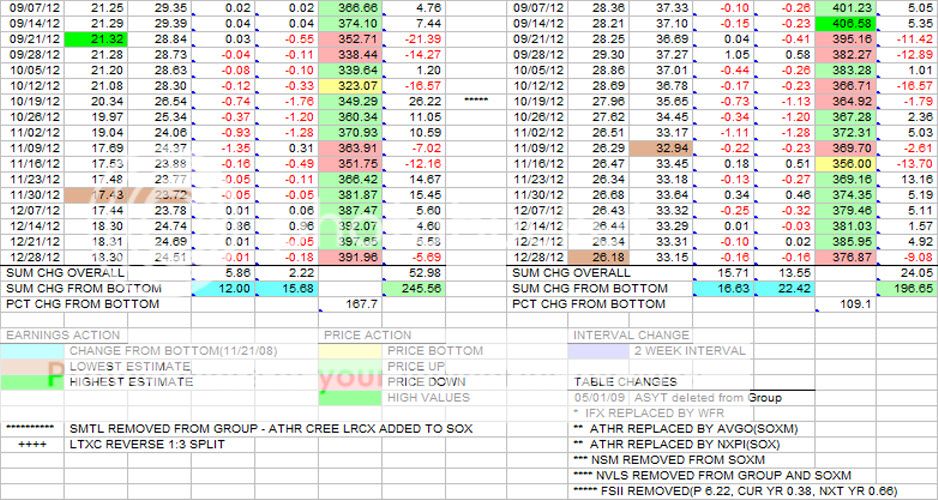
Since this is(effectively) the end of 2012 with only the last day of the quarter and the end of the CY/FY this coming Monday, 10/31, this posting will be of all portions of the table going all the way back to the beginning on 8/29/08, over 4 years ago. A lot of ups and downs along the way over this period, but mostly, the trend has been sideways and will most likely, IMO, to stay that way for another 4 years at least. On 8/29/08 the SOX closed at 352.82. This past week's closing on 12/28/12 was 376.87(+6.8%). However, during the past 4+ years there have been several opportunities to make some "big money" by buying and selling in synch with the market ups and downs as the long term trend moved sideways. The same should happen over the next 4+ years. We just have to pick the right times and the right stocks that's all!
This past week has seen a turn around in the nice price runup during the previous 5 weeks(+8.4%). Looking at the entire 4+ year period, 5 week runups have not occurred very often so the "pressure" was on this past week to move down. The market obliged with a downturn of -2.4 percent. Notice that the earnings estimates for both the Group and SOXM all moved to the downside. More of the same, at least over the short term could well be in the "cards". Looking at the estimates in the table, the peak occurred in the Mar/Apr time frame of 2011. Since then, the trend has been down with new minimums being set every several weeks until the present time.
With the 4th quarter and and CY/FY 2012 ending for most stocks this coming Monday, the reporting beginning in mid-January through Feb and into March should give us lots of clues for the upcoming year. Consensus views by the analysts will be revised upon the company reports and CEO "visions" for the future year, or more. Also, the economic outlook for both the U.S. and the World will continue to unfold as time progresses. In the midst of all this reporting, perhaps a new uptrend cycle can begin.

 |


