SI
SI
discoversearch

We've detected that you're using an ad content blocking browser plug-in or feature. Ads provide a critical source of revenue to the continued operation of Silicon Investor.  We ask that you disable ad blocking while on Silicon Investor in the best interests of our community.  If you are not using an ad blocker but are still receiving this message, make sure your browser's tracking protection is set to the 'standard' level.
Strategies & Market Trends : 2026 TeoTwawKi ... 2032 Darkest Interregnum
GLD 375.93-1.8%Nov 14 4:00 PM EST

 Public ReplyPrvt ReplyMark as Last ReadFilePrevious 10Next 10PreviousNext  
To: Haim R. Branisteanu who wrote (100209)4/23/2013 10:51:43 PM
From: John Pitera  Read Replies (2) of 217781
 
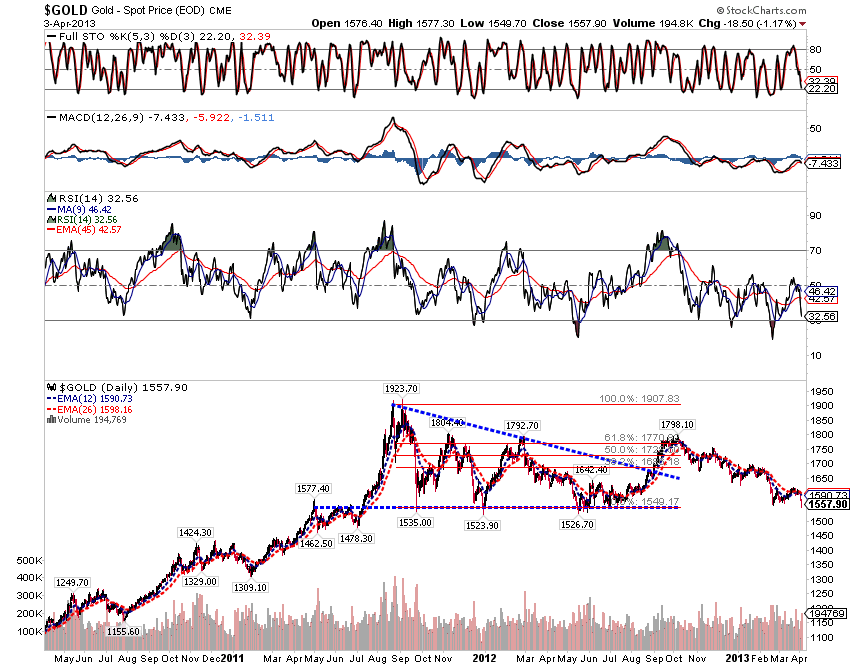
A very reasonable assumption regarding the Central Banks...........Ron Paul was on cnbc questioning Goldman Sach's motives for their issuing a sell right before the collapse but truth be told I posted a chart and was pretty bearish on Gold for a significant move down back on April 4th. I'm not certain we get the $400 downside, but we had that 2 day slip of $215 in pretty dramatic fashion.

John

To: Yorikke who wrote (13977)4/4/2013 1:59:05 AM
From: John Pitera1 Recommendation Read Replies (1) of 14052
Hi Y,

here is a chart........gold is in a very interesting and fairly complicated pattern.....it has many elements
of a market that is in a descending triangle which usually one of the most reliable chart patterns to which would suggest that we will break the horizontal baseline support and in that case a reasonable target for the ultimate end of the decline would be about $400 lower than 1923$ price top out in Sept of 2011 and these jagged lows
in say thw 1528-1535 range....... the chart looks lousy and I would not be looking to buy this support but would be shorting it on a break 2 day close below $1500 andwondering what will be happening in the global economy if it goes down $400 bucks from here.

The very deep momentum generated on the RSI on it's Feb 2013 decline almost mandates that this chart is going go break down and the price of gold denominated in USD is going lower.


The XAU is down 50% and is showing a double momentum buy signal, but a quarter of those companies are on the financial rocks....... if gold breaks down and we see a meaningful decline, then I do not know how you can say that TA is Nonsense.

Our FED and the Central Banks of the world have driven us off into fantasy worlds........ but I would not throw the baby out with the bathwater......... Interesteing the XAU..... which is down from 228 to 128...... that chart is actually showig a double momentum buy divergence...... but remember its for the companies that staty in business....

John

PS constance brown has written an excellent book on TA that has been updated in 2012.....she has a very interesting of using a methodology of using specifice ema averagers overlaid on the RSI and I believe she's on to something good.

I hope to discuss her methodology..... and maybe generate a few books sales for her sometime soon.

John
Report TOU ViolationShare This Post
 Public ReplyPrvt ReplyMark as Last ReadFilePrevious 10Next 10PreviousNext