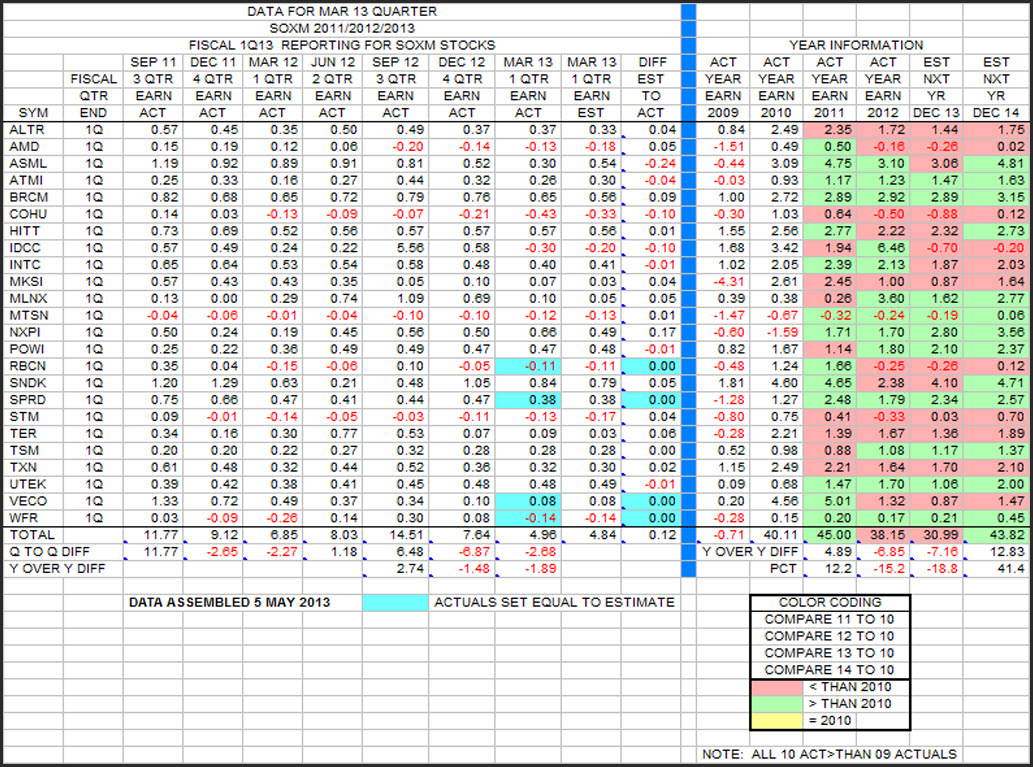
This is an updated tabulation of quarterly earnings for the 24 of 39 SOXM stocks that report on a FY/CY basis.
Twenty of the 24 stocks have official results posted with 4 remaining for a complete list. Those 4 stocks are shown with the blue block color coding. Rather than wait for another week or more to obtain the official results for these stocks, the actuals have been posted to equal the estimates. This allows bottom line numbers to be computed that will allow comparison to past and future bottom line numbers. The final data will change a little at the bottom line, but general conclusions that are made with the present data should be useful.
Both quarterly and yearly information is shown in the table. Looking at the quarterly data first, bottom line numbers show a general downward trend as time progresses. The bottom line number for this March quarter will be around 4.96 which is well down from last quarter as well as down from the Mar 12 quarter. In fact, this March quarter is well below any quarter in the table going back to the Sep 11 quarter.
Next on the right hand side of the table is shown yearly earnings data going back to 2009. Actual data is shown through 2012 with present estimates for 2013 and 2014. As noted, color coding is used to make it easier to digest the different performance of individual stocks going forward from 2010 as the base year. While there are stocks that have mixed red and green performance over the 4 years from 2010; ALTR, COHU, MKSI, STM, TER, and TXN are shown all in red. ATMI, BRCM, MTSN, NXPI, SPRD, UTEK, and WFR are shown all in green. Looking at the 2013 and 2014 estimates for the 24 stocks, 14 of the 24 stocks in 2013 are shown under 2010 actuals and 11 of the 24 stocks in 2014 are shown under 2010 actuals.
Looking at the bottom line numbers for the yearly data, 2011 was up from 2010, but 2012 and 2013 will be down from 2010. 2014 shows a "big leap" upward from the 2013 present estimate, and slightly higher than the 2010 actuals. Looking at the y-o-y difference, 2012 is down 15.2 percent from 2011, and 2013 is estimated to be down 18.8 percent from 2012 actuals.
 |


