SI
SI
discoversearch

We've detected that you're using an ad content blocking browser plug-in or feature. Ads provide a critical source of revenue to the continued operation of Silicon Investor.  We ask that you disable ad blocking while on Silicon Investor in the best interests of our community.  If you are not using an ad blocker but are still receiving this message, make sure your browser's tracking protection is set to the 'standard' level.
Strategies & Market Trends : John Pitera's Market Laboratory

 Public ReplyPrvt ReplyMark as Last ReadFilePrevious 10Next 10PreviousNext  
To: ajtj99 who wrote (14256)7/1/2013 4:05:19 PM
From: John Pitera1 Recommendation

Recommended By
roguedolphin

  Read Replies (1) of 33421
 
As Art Cashin points out the first few days of the month are when we have new money inflows and are statistically stronger days.... Here are several charts that show us that the Daily SPX and DJIA are currently being sold at the 50 DMA (simple MA)... The RUT and COMPQ are showing relative strength but are in downtrends... The NASDAQ Composite is currently in a sell mode on the RSI daily MA system.

Today was a classic bear market type of day where we opened very strong with lots of optomism and then the Professional Global Asset managers came in and sold and are lightening their US Equity holdings and their is a desperate scramble out of Risk assets and a Massive desire to raise cash... by any means possible. the very last chart is probably the most important of the day... the 90 day bil chart,,, Yield had the biggest % move of any market today.


The EUR has been rising very short term but it un


xxxxx


Silver has continued the rally it began on Friday.....


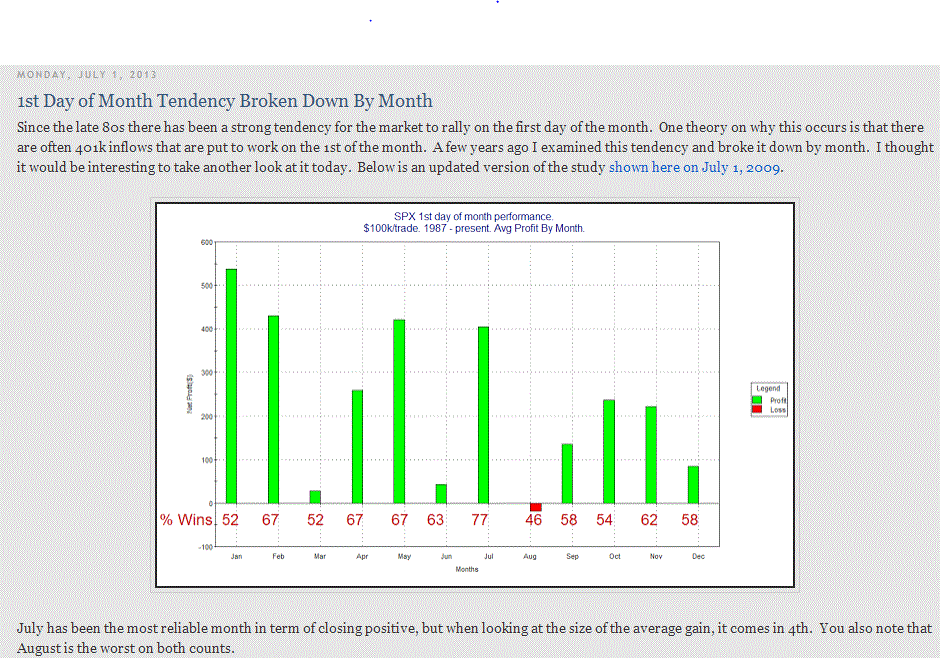
The 1st day of July is the one of 4 months that is very strong going back to 1988.... Jan Feb May and July are the 4 months that have the strongest first day. Courtesy of AJ and Quantifiable Edge Blog....


The EUR went into sell mode when the 9 period MA crossed below the 45 period EMA on the RSI chart which also coincides with it breaking below the 50 and 200 DMA....


A One year EUR/$ chart with less clutter and focus on it's over all downtrend, the fact that impulse waves have been to the downside over the last 9 plus months and it has resistance from Multiple moving averages especially the 200 DMA and the 50 DMA


And Most critically the 10 year note yield hovering right at the key 2.50% level.... so far the increase in yield has looked very Elliott wave impulse type..... The market is caught on the wrong side..... we do have a gap to fill on the daily chart and you will notice that is right where it would bonds would be sold by technical sellers as it's the 21 Day Simple Moving Average and the 26 day Exponential MA... which is used in other trading systems those to converge right where the gap would be filled .... what wil really freak out the markets is if the TNX makes a new high in Yield above 2.61% prior to filling that GAP. since this is a Holliday week... we may not see much happen.... but Japan and China interest rate and currency developments as well as the weakness in the Indian currency, the Brazilian Real.. and emerging market currencies...and in Egypt we have major geopolitical uncertainty..... China, Russia and the US are in a turf war on multiple fronts and obviously the National Security Agency's Snowdon is providing friction...... Lots of developments occuring all over the globe.

Finally the true canary in the coal mine...


have a great day.

John
Report TOU ViolationShare This Post
 Public ReplyPrvt ReplyMark as Last ReadFilePrevious 10Next 10PreviousNext