of course; technology has improved over the last 150 years. We don't collect water and expose it to wind chill on the deck of a ship anymore.
Of buckets and blogs
gavin @ 1 June 2008
This last week has been an interesting one for observers of how climate change is covered in the media and online. On Wednesday an interesting paper ( Thompson et al) was published in Nature, pointing to a clear artifact in the sea surface temperatures in 1945 and associating it with the changing mix of fleets and measurement techniques at the end of World War II. The mainstream media by and large got the story right – puzzling anomaly tracked down, corrections in progress after a little scientific detective work, consequences minor – even though a few headline writers got a little carried away in equating a specific dip in 1945 ocean temperatures with the more gentle 1940s-1970s cooling that is seen in the land measurements. However, some blog commentaries have gone completely overboard on the implications of this study in ways that are very revealing of their underlying biases.
The best commentary came from John Nielsen-Gammon’s new blog where he described very clearly how the uncertainties in data – both the known unknowns and unknown unknowns – get handled in practice (read that and then come back). Stoat, quite sensibly, suggested that it’s a bit early to be expressing an opinion on what it all means. But patience is not one of the blogosphere’s virtues and so there was no shortage of people extrapolating wildly to support their pet hobbyhorses. This in itself is not so unusual; despite much advice to the contrary, people (the media and bloggers) tend to weight new individual papers that make the news far more highly than the balance of evidence that really underlies assessments like the IPCC. But in this case, the addition of a little knowledge made the usual extravagances a little more scientific-looking and has given it some extra steam.
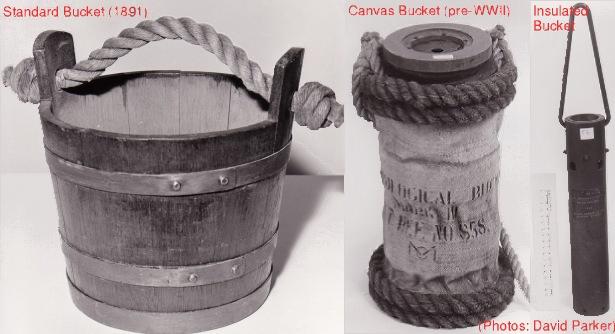
Like almost all historical climate data, ship-board sea surface temperatures (SST) were not collected with long term climate trends in mind. Thus practices varied enormously among ships and fleets and over time. In the 19th Century, simple wooden buckets would be thrown over the side to collect the water (a non-trivial exercise when a ship is moving, as many novice ocean-going researchers will painfully recall). Later on, special canvas buckets were used, and after WWII, insulated ‘buckets’ became more standard – though these aren’t really buckets in the colloquial sense of the word as the photo shows (pay attention to this because it comes up later).
The thermodynamic properties of each of these buckets are different and so when blending data sources together to get an estimate of the true anomaly, corrections for these biases are needed. For instance, the canvas buckets give a temperature up to 1ºC cooler in some circumstances (that depend on season and location – the biggest differences come over warm water in winter, global average is about 0.4ºC cooler) than the modern insulated buckets. Insulated buckets have a slight cool bias compared to temperature measurements that are taken at the inlet for water in the engine room which is the most used method at present. Automated buoys and drifters, which became more common in recent decades, tend to be cooler than the engine intake measures as well. The recent IPCC report had a thorough description of these issues ( section 3.B.3) fully acknowledging that these corrections are a work in progress.
And that is indeed the case. The collection and digitisation of the ship logbooks is a huge undertaking and continues to add significant amounts of 20th Century and earlier data to the records. This dataset ( ICOADS) is continually growing, and the impacts of the bias adjustments are continually being assessed. The biggest transitions in measurements occurred at the beginning of WWII between 1939 and 1941 when the sources of data switched from European fleets to almost exclusively US fleets (and who tended to use engine inlet temperatures rather than canvas buckets). This offset was large and dramatic and was identified more than ten years ago from comparisons of simultaneous measurements of night-time marine air temperatures (NMAT) which did not show such a shift. The experimentally-based adjustment to account for the canvas bucket cooling brought the sea surface temperatures much more into line with the NMAT series ( Folland and Parker, 1995).
realclimate.org
here are some of the papers..
CORRECTION OF INSTRUMENTAL BIASES IN HISTORICAL
SEA SURFACE TEMPERATURE DATA
C. K. Folland* and D. E. Parker
(Meteorological Office, Bracknell, UK)
* Corresponding author: Hadley Centre for Climate Prediction and Research, Meteorological Office, London Road, Bracknell, Berkshire RG12 2SY, UK.
(Received 2 August 1993; revised 27 May 1994)
ftp://podaac.jpl.nasa.gov/allData/gosta_plus/retired/L2/hdf/docs/papers/1-crrt/1-CRRT.HTM
We describe a physically based empirical technique for correcting historical sea surface temperature measurements for time-varying biases. The corrections are based on models of heat and moisture transfers from uninsulated (canvas) and partially insulated (wooden) sea temperature buckets exposed on deck. One of the canvas bucket models is tested using measurements on board ship and published wind-tunnel measurements. The method gives geographically and seasonally varying bias corrections through the period 1856 to 1941. The corrections are fairly insensitive to uncertainties such as the size of the bucket or the details of its exposure on deck. A discussion of the history of sea surface temperature observations provides a background to the procedure .
=
Improved estimates of upper-ocean warming and multi-decadal sea-level riseCatia M. Domingues 1,et al
nature.com
=
Global ocean heat content 1955–2008 in light of recently revealed instrumentation problems
onlinelibrary.wiley.com |


