| | | As shown by your chart, SUNE price bottomed at 1.44 in the middle of 2012. Up until that point, S&P had positioned them with a "star" value of 2 for quite a few months. Then in mid 2012 they raised the ranking to a 3 for about 9 months, and then around Feb of this year, they jumped the rank from a 3 to a 5. It remained at a 5 level(strong buy) until the day before the earnings announcement on Monday when they went back to a 4 level(Buy). Then on Tuesday, earnings were released and we know what happened yesterday. After the earnings announcement, S&P reaffirmed their 4 ranking.
During the last many months, other analysts have raised their ratings on SUNE. From the low point of 1.44 in 2012, the stock had risen to a high of 10.47 on 7/30/13 when it started to recede a little. The stock has been bouncing from yesterday's close, presently around +7 percent.
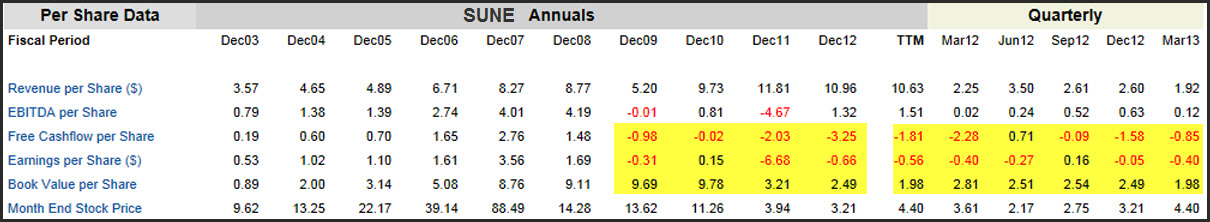
SUNE has been trying over several years to "re-invent" itself. Mostly by going into the solar sector. Maybe this process has been going OK overall, but during this period, fundamentals have suffered. The table shows some of the issues.
gurufocus.com
Everyone can review the numbers themselves, but I highlighted a few that shows deterioration on a per share basis over the past few years. These numbers have to improve to go along with higher stock prices.
 |
|


