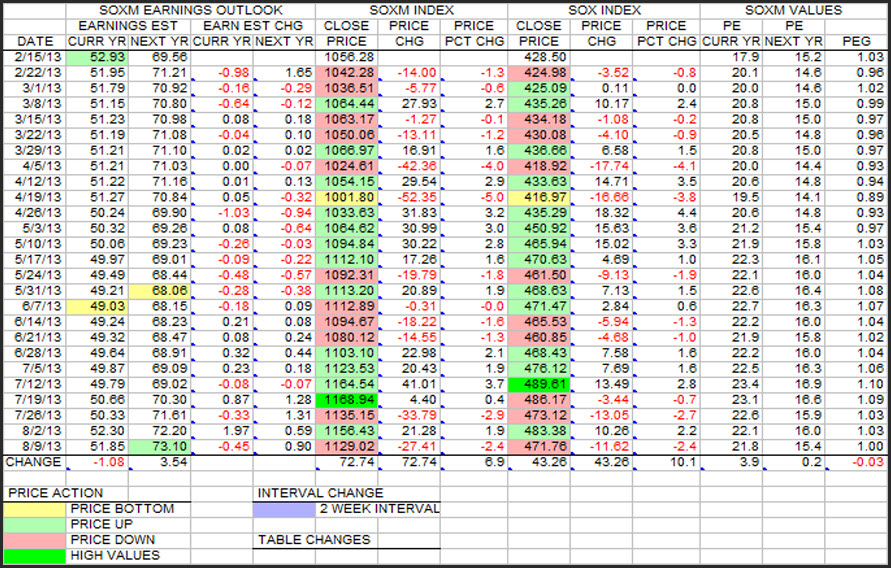
| | | This is the weekly update of the SOXM stocks in terms of earnings estimates and price changes for the indices along with the history of PEs and PEG shown in table and chart form.
Looking at the table first, Cur Yr and Nxt Yr earnings estimates have remained fairly stable since the start of the table on 2/15/13, but there is a small divergence at the bottom line. Cur Yr estimates have decreased slightly while Nxt Yr estimates have increased a little. This is a somewhat natural happening when reality strikes that near term earnings are being "pushed out" while optimism tends to spring forth eternal about how good it is going to be Nxt Yr.
Looking at the index prices, they show up much the same as the earnings estimates, ie, relatively small changes over the period of the table. The SOXM is up 72.72(+6.9%), and the SOX is up 43.26(+10.1%). These are good numbers of course, but they have been better in the recent past. The peak values have occurred the weeks of 7/12 and 7/19. Since then, the trend has been slightly down.
For the table period, both the SOXM and SOX indices hit bottom the week ending 4/19. Since then the trend was up until the weeks of 7/12 and 7/19. The last 3 to 4 weeks have trended down. The earnings estimates hit minimums the weeks of 5/31 and 6/7. Since then the trend has been up with the Nxt Yr estimate hitting a new high just this past week.
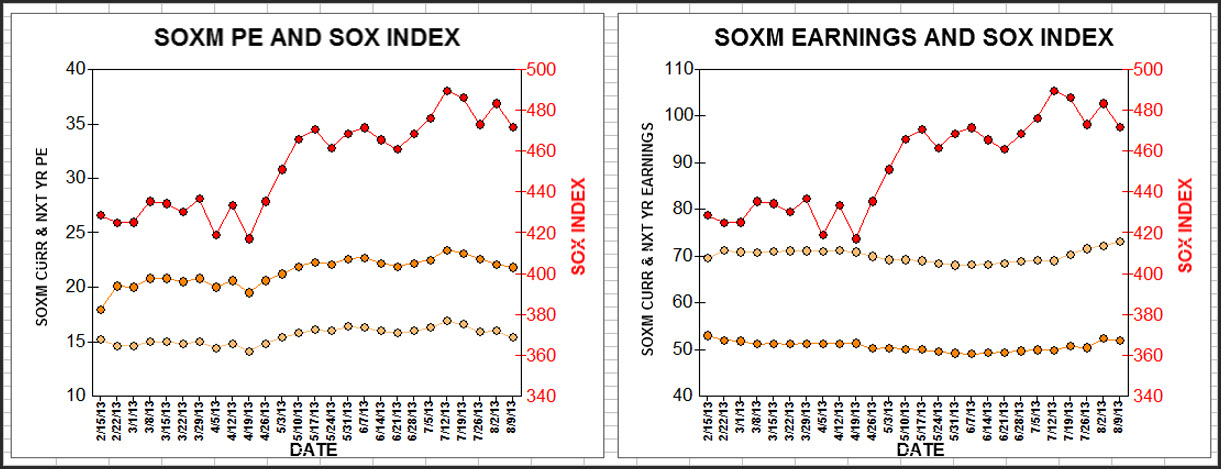
The 2 charts give a graphic view of the trends for earnings estimates and PEs along with the SOX index. It looked like the SOX was going to punch through the 500 level, but it was not to be. Along with this retreat in the SOX, Cur Yr and Nxt Yr PEs are trending down while earnings estimates are trending up although Cur Yr is slower than NxtYr raising the "spread" between the 2 numbers. Again, this shows rising optimism for the future. IMO this optimism is way overdone, but we shall see how it all turns out next year at this time.
 |
|


