This is the weekly update of the SOXM and SOX tables in terms of week end earnings estimates and earnings estimate changes from last week for the SOXM stocks, price and price changes for the SOXM and SOX indices, and updates for the weekly Cur Yr, and Nxt Yr PEs, and PEGS for the SOXM. Also shown are 2 charts showing the SOX index along with Cur Yr and Nxt Yr earnings estimates and PEs.
Both the SOXM and SOX indices were down this week continuing the downtrend started last week. From the start of the table, 2/15/13, the SOXM is up 4.2 percent, and the SOX is up 7.9 percent.
The table shows precise values and changes from week to week in actual and percent form for the SOXM and SOX indices. This makes it easy to see the different periods and characteristics of the market as the weeks go by. Take for instance, the "4" weeks in May when the market was really trending upward hot and heavy. A more recent time frame is the 3 weeks from 6/28 thru 7/12 for the SOX sending the SOX up almost 30 points or about 6 percent to hit the peak in the table of 489.61. In the last 2 weeks, the SOX has fallen nearly 20 points. For the last 5 weeks from 7/12 the trend has been down.
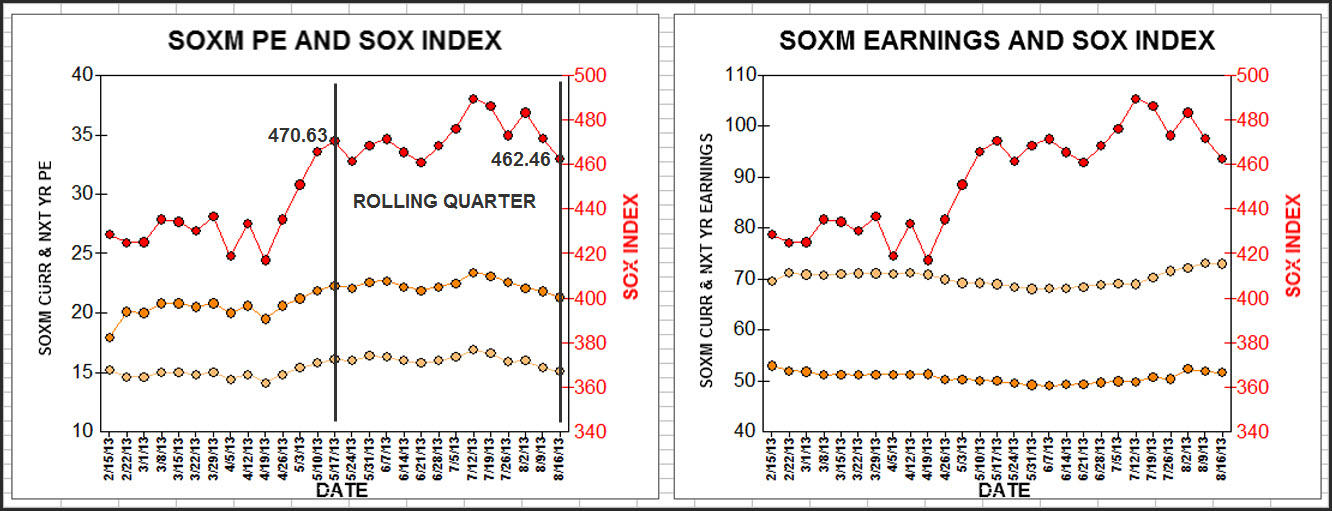
Now on to the charts. I added a couple of vertical lines to the PE chart to show this week's 13 week rolling quarter. At the beginning of the 13 week period, the SOX index was 470.63. This past week it closed at 462.46(-1.7%). The first 5 weeks of the period had a flat to slight downward trend, then 3 strong up weeks, and recently 5 weeks of a downtrend. Earnings estimates and PEs have been relatively flat over the period.

 |


