| | | Hi mindmeld; When you see two variables that correlate with one another there are three natural things to conclude. A causes B, B causes A, or something else causes both of them.
But in your graph, CO2 and temperature have appraently become decoupled:
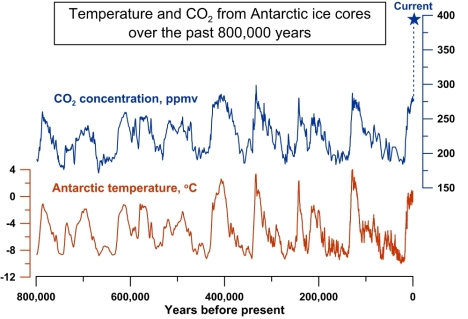
simpleclimate.files.wordpress.com
In the case of CO2 and temperatures, your graph shows that CO2 can't cause temperature. If it did, instead of experiencing 0.5 degrees of temperature rise, according to the scale on your charts we should be seeing about 8 degrees C of temperature rise, LOL.
When they saw the graph you're showing, and they made the critical assumption that CO2 drives temperatures, you can see how convinced the alarmists were that temperatures would keep on rising.
When temperatures failed to rise, the alarmists were totally surprised. They had no backup plan. That's why they're completely at sea, with one alarmist making speculations that are incompatible with the next.
So of course people no longer believe the predictions. The alarmists were so completely surprised by the pause that they're all spouting different "explanations". And since the explanations are incompatible as in "oh it went into the ocean", "oh this is natural variation", "oh temperatures are still going up", nobody believes you anymore. Y'all can't keep your stories (excuses) straight.
-- Carl |
|


