SI
SI
discoversearch

We've detected that you're using an ad content blocking browser plug-in or feature. Ads provide a critical source of revenue to the continued operation of Silicon Investor.  We ask that you disable ad blocking while on Silicon Investor in the best interests of our community.  If you are not using an ad blocker but are still receiving this message, make sure your browser's tracking protection is set to the 'standard' level.
Gold/Mining/Energy : Gold and Silver Miners and the U.S Markets.

 Public ReplyPrvt ReplyMark as Last ReadFilePrevious 10Next 10PreviousNext  
To: The1Stockman who wrote (1758)4/4/2014 9:49:55 PM
From: Robov1 Recommendation

Recommended By
Beam

  Read Replies (1) of 1954
 
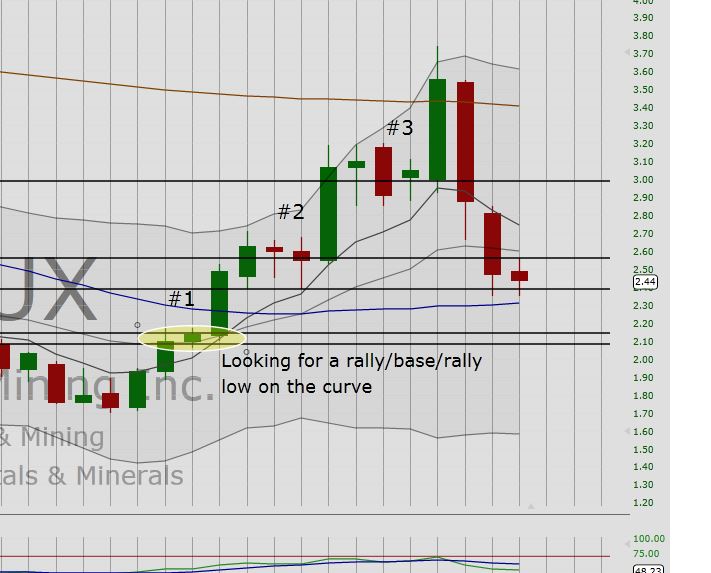
Well here's what I see Jammes. And its that 2 teens level. When I'm looking for key supply or demand levels on a chart, in other words area's on the chart that indicate strong institutional buying, I'm looking for explosive moves higher as indicated buy long extended range green candles. And I'm looking for a level that is FRESH, meaning price has not come back to that level and a level that is LOW on the curve. Meaning about a 70-75% retracement from the overall move from bottom to top and you want to see price come back to that level in a somewhat dramatic fashion like a 90° to minimum 45° retracement. What you see on this chart are two smaller back to back extended range candles coming off the bottom with a very tight one week basing candle right in the 2.06 - 2.17 range for that week followed by a much bigger extended range green candle which is only .03¢ in its overall range of the two lower candles wrapped up in one candle. As you can see candle #3 did not hold as demand as price blew right through that level, while candle #2 also did not hold as demand and price fell below the lowest candle in that base. That opens up the area circled in yellow as THE freshest level of strong demand and it also happens to be just below a 75% retracement. In other words it is an ideal location based on the parameters we use in our training as an area that offers a high probability of a large number of institutional buy orders sitting, waiting to be filled. My expectation if/when price hits that level is that it will be a strong move from that level similar to the prior move from that level. I personally have my buy orders in at that level.
Will we get there? I don't know because like I said, this isn't a game of certainties but of high probabilities and if price reaches that level there is a high probability that there is a large stack of institutional buy orders somewhere in that range. If I'm wrong......well.... that's why stops are important. We are looking for maximum reward with minimum risk. If we are wrong we have a tight stop and risk a little bit of loss, but if right the upside potential far outweighs the risk. As far as MA's or Stoch or any other indicator on the chart they frankly are really secondary. What we are taught to look for are key area's low on the curve if buying, high if selling where there are very likely a large stack of institutional buy/sell orders patiently waiting to be filled. It really is that simple!

Report TOU ViolationShare This Post
 Public ReplyPrvt ReplyMark as Last ReadFilePrevious 10Next 10PreviousNext