<Coppock Market Message: Get Out And Stay Out - Check Back In Q1 2015
05/05/2014 12:44
Submitted by Charles Hugh-Smith of OfTwoMinds blog, This chart's value is in posing an if-then question: if today's S&P 500 follows these patterns, what will our reaction be?
Longtime contributor B.C. recently submitted a chart that combines two interesting market tools: the Coppock Curve and historical analogies. Coppock called his technical invention the Very Long Term (VLT) Momentum indicator, and the so-called "killer wave" is a top followed by a second lower peak.
This chart shows the Coppock Curve for the S&P 500, overlaid against previous deflationary secular Bear Markets in the late 1800s, the U.S market in the 1920s and 30s and the Japanese Nikkei stock market index
from 1986 to the present.
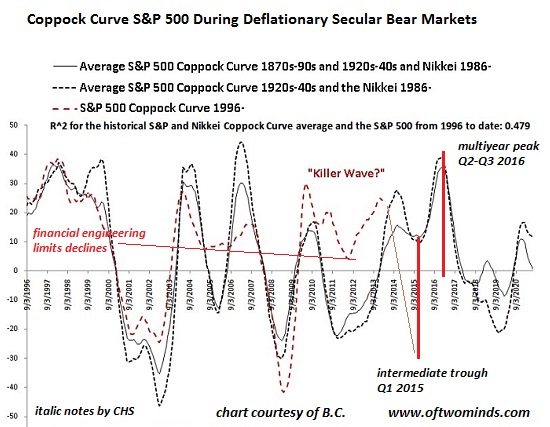
I have added notes to the chart to mark the potential market bottom in early 2015 and a possible peak in Fall 2016. I also added a note that suggests the shallow troughs in 2005 and 2011 were the result of unprecedented financial engineering by central banks: financial authorities have been dead-set on limiting market declines and "buying time" so the broken parasitic financial system could feed off the real economy long enough to restore its viability.
If any indicator issued to-the-day signals that worked 100% of the time, everyone would follow the signal and it would lose its predictability. As a result, any signal--and any historical analogy--is simply one possibility of many. This chart's value is in posing an if-then question: if today's S&P 500 follows these patterns, what will our reaction be?
Economist Steen Jakobsen has opined that the S&P 500 is due for a 30% decline with a bottom in late 2014 or early 2015. This aligns rather neatly with the Coppock Curve's implied bottom.
At last week's Wine Country Conference, Jakobsen reported that his models suggest a rally is likely from the low in early 2015 up to the election in 2016. That also aligns with the implied peak in the Coppock Curve.
On the other hand, the market could tumble 30% and stumble along at that level for months. Or the market could drop 30%, stabilize for a time, and then take another leg down.
All we can do is remain alert for possibilities and probabilities, i.e. ask what is likely. The conventional consensus is that the Fed's liquidity will keep the market wafting higher, along with corporate profits, if not forever, then close enough to forever that there is nothing to worry about.
Skeptics see vulnerabilities galore, starting with the consensus being so one-sided. When everyone's on one side of the trade, it doesn't take much of a wave of volatility to swamp the boat and send it to the bottom.
The Coppock Curve's message is straightforward: get out of the market and stay out until at least the first quarter of 2015. After five years of upside, the old trading saw comes to mind: bulls make money, bears make money, but pigs get slaughtered.>
http://www.zerohedge.com/news/2014-05-05/coppock-market-message-get-out-and-stay-out-check-back-q1-2015
|


