" Are you interested in “reconstructing” the medieval Dow Jones"
Stanley Cup alert...
Tim Ball recycling Medieval Warming conspiracies at WUWT
Sou | 7:39 AM
At WUWT, Tim Ball is pining for the good old days - twenty five years ago. He's written (again) about the medieval warm anomaly and wishing it was global (archived here). I don't know why he harps on about it so. I think it's an excuse to name drop - he says he once met up with Hubert Lamb and he tells everyone so at every opportunity. He likes to pretend they were bosom buddies, though I doubt Hubert Lamb would have remembered Tim Ball, even had he met him.
I've written about the medieval warm anomaly on previous occasions - here and here and in some detail here, for example. There's really not that much more to be said, so I'll just repeat what I've written on another occasion when Tim moaned about the MWP:
Both the medieval warm anomaly and the Little Ice Age were real. What Tim is objecting to is that science now shows that neither of them were global in effect. Not everywhere got warm and cold during those periods and those that did didn't get warm and cold all at the same time.
More studies have been done since 2001, not surprisingly. The latest IPCC report has this to say (TS.2.2.1 Surface):
Continental-scale surface temperature reconstructions show, with high confidence, multidecadal intervals during the Medieval Climate Anomaly (950 to 1250) that were in some regions as warm as in the mid-20th century and in others as warm as in the late 20th century. With high confidence, these intervals were not as synchronous across seasons and regions as the warming since the mid-20th century. Based on the comparison between reconstructions and simulations, there is high confidence that not only external orbital, solar and volcanic forcing, but also internal variability, contributed substantially to the spatial pattern and timing of surface-temperature changes between the Medieval Climate Anomaly and the Little Ice Age.
Tim is rather fond of a graphic from the first IPCC assessment report (FAR), which was published 25 years ago before better reconstructions were available. Deniers only ever show the bottom panel, so for a change I'll show all three panels from Figure 7.1 of FAR:
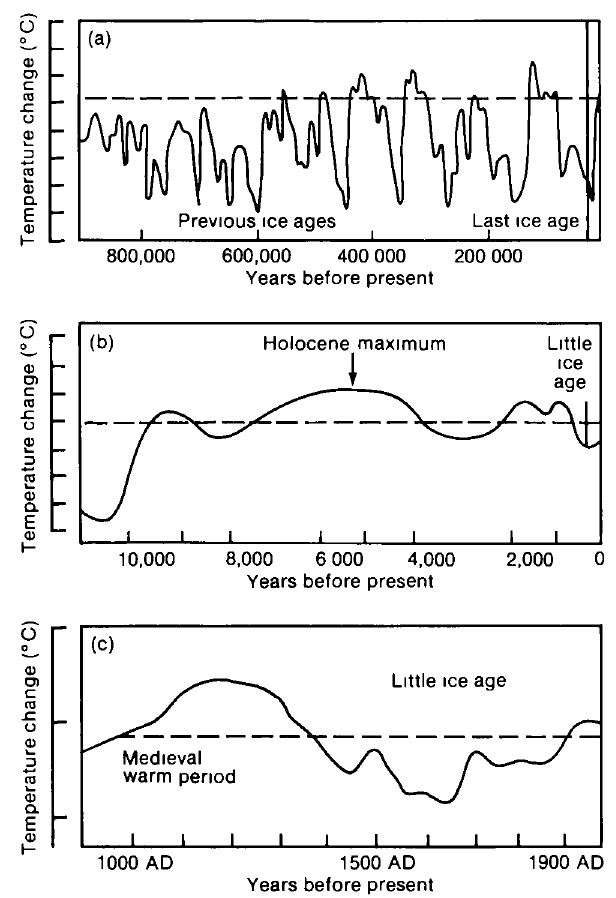 | | Figure 7.1: Schemat1c diagram of global temperature variations since the Pleistocene on three time scales (a) the last million years (b) the last ten thousand years and (c) the last thousand years. The dotted line nominally represents conditions near the beginning of the twentieth century. Source: IPCC FAR (1990) |
Tim says that the IPCC created three "problems":
The three problems it created were
- The Medieval Warm Period (MWP) contradicted their claim that the 20th century was the warmest ever.
- The Little Ice Age (LIA) showed that the present warming trend began prior to the major impact of the Industrial Revolution. Significant production of CO2 by humans began only after World War II.
- The trend of the warming since circa 1650 A.D., the nadir of the LIA, was well within natural variability.
He's wrong. First of all, there is no claim in FAR that the twentieth century was the warmest ever. If Tim had bothered to read the text on the same page as the chart he showed, he would have found this - written 25 years ago in FAR:
There is growing evidence that worldwide temperatures were higher than at present during the mid-Holocene (especially 5000-6000 BP), at least in summer, though carbon dioxide levels appear to have been quite similar to thos of the pre-industrial era at this time (Section 1).
His second point makes little sense. It's not the Little Ice Age that shows that temperatures warmed, it's the temperature record that showed that it has warmed. And it hasn't stopped - and won't for some time yet:
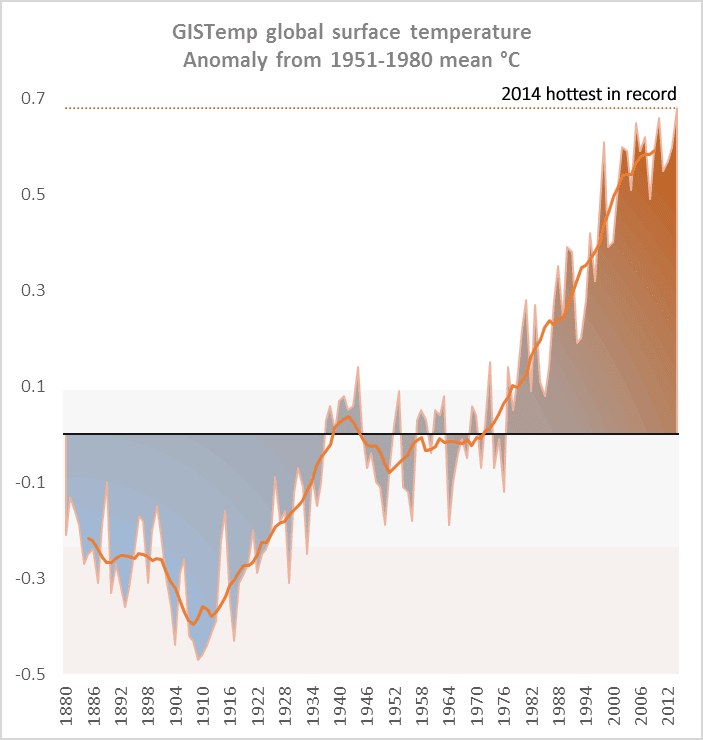
Tim shows no evidence that this recent warming as shown above is "within natural variability" because he can't. It isn't. It can only be explained by greenhouse warming from human activity. Tim just says that because he can get away with writing nonsense on a denier website like Anthony Watts' WUWT.
As if to prove he is no scientist, Tim also writes about something he did manage to read in FAR:
Discussing the various explanations for the LIA cooling they wrote; “Some have argued that an increase in explosive volcanism was responsible for the coolness (for example Hammer, 1977, Porter, 1986), others claim a connection between glacier advances and reductions in solar activity (Wigley and Kelly, 1989) such as the Maunder and Sporer solar activity minima (Eddy, 1976), but see also Pittock (1983). Note that these are the same arguments made for the current “hiatus” in temperatures. Also, notice the name of Tom Wigley, former Director of the CRU and a central figure in the 2001 IPCC, attributing the cooling to solar activity. The actual reference given is: Wigley, T M L , and PM Kelly, 1989 Holocene climatic change, 14C wiggles and variations in solar irradiance Phil. Trans. Royal Society London, (in press).
Apparently, the article listed as “(in press)” never appeared because Wigley’s publication list at the CRU doesn’t list it.
Well, yes. Is Tim now arguing that natural factors don't affect climate? Volcanoes and solar variations do affect the weather - and even climate if the forcings are big enough and last long enough.
You'll also notice that Tim doesn't know how to use Google. Here is the Wigley and Kelly paper that he couldn't find, right where it is meant to be on the site of the Philosophical Transactions of the Royal Society of London - and it's open access as well (maybe only till the end of March).
I won't bother with the rest of the tripe from Tim. It's his usual fare minus any quotes from his heros ( Hitler and Osama bin Laden).
Latest temperature reconstructions
To complete this article here is the latest IPCC view of temperatures going back in time. You can see that a lot of work has been done since 1990. Click to enlarge it.
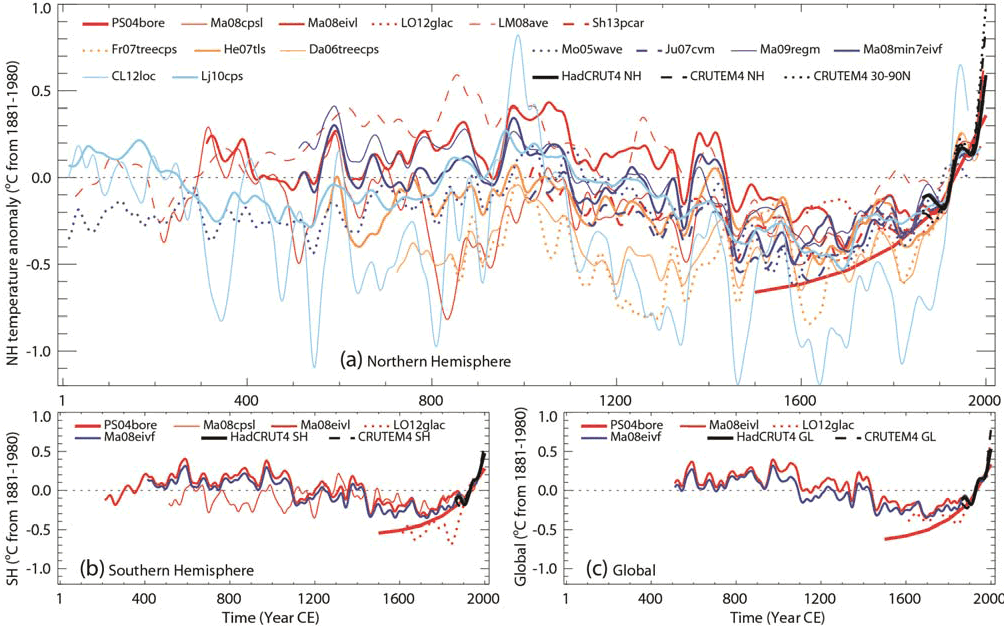 | | Figure 5.7: Reconstructed (a) Northern Hemisphere and (b) Southern Hemisphere, and (c) global annual temperatures during the last 2000 years. Individual reconstructions (see Appendix 5.A.1 for further information about each one) are shown as indicated in the legends, grouped by colour according to their spatial representation (red: land-only all latitudes; orange: land-only extra-tropical latitudes; light blue: land and sea extra-tropical latitudes; dark blue: land and sea all latitudes) and instrumental temperatures shown in black (HadCRUT4 land and sea, and CRUTEM4 land-only; Morice et al., 2012). All series represent anomalies (°C) from the 1881–1980 mean (horizontal dashed line) and have been smoothed with a filter that reduces variations on timescales less than ~50 years. Source: IPCC AR5 WG1 |
blog.hotwhopper.com |


