Gold In The Age Of Soaring Debt
Ever wonder how much gold has ever been exhumed in the history of the world? The GFMS Gold Survey estimates that the total amount is approximately 183,600 tonnes, or 5.9 billion ounces. If we take that figure and multiply it by the closing price on June 16, $1,181 per ounce, we find that the value of all gold comes within a nugget’s throw of $7 trillion.
This is an unfathomably large amount, to be sure, yet it pales in comparison to total global debt.
According to management consulting firm McKinsey & Company, the world now sits beneath a mountain of debt worth an astonishing $200 trillion. That’s greater than twice the global GDP, which is currently $75 trillion. If we were to distribute this amount equally to every man, woman and child on the face of the earth, we would each owe around $28,000.
More surprising is that if gold backed total global debt 100 percent, it would be valued at $33,900 per ounce.
Try convincing your gold dealer of this next time you want to sell a coin.

Besides imagining being able to buy a new BMW with a single American Gold Eagle coin, why is it important to think of the yellow metal in this way?
The Case of the Runaway Debt
To answer that, let’s back up a bit. For thousands of years, in countless cultures around the world, gold has been recognized as an exceptional store of value and, as such, accepted in all forms of transactions. A new archeological discovery, in fact, shows that the metal was being traded in the British Isles as far back as 2500 B.C., an entire millennium before the world’s first gold coins were minted in what is now present-day Turkey.
Up until the twentieth century, most nations were still using the gold standard. Just as most music is composed in a particular key signature to control tonality, the gold standard has historically provided long-term stability and inflationary controls. Even so, several financiers and central bankers throughout history tried experimenting with a fiat currency system, a decision which often led to major imbalances between monetary and fiscal policies, and eventually economic depressions. Last week I shared two such examples, including Scottish gambler John Law’s four-year experiment with paper money in the early eighteenth century, which ruined France’s economy and laid the groundwork for the French Revolution.
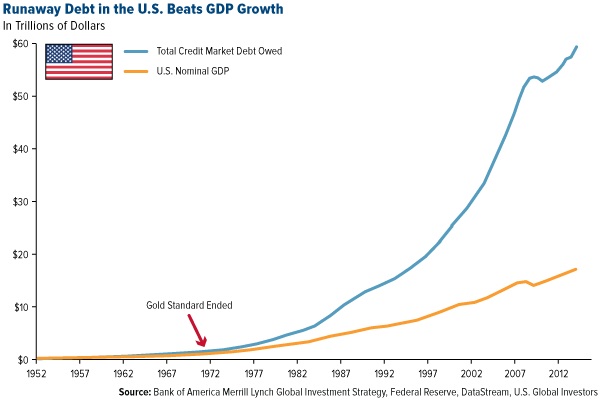
More to the point, the gold standard limits the amount of debt that can be issued. Forty-four years ago, when the U.S. made the switch to a fiat currency system, the federal government owed $399 billion. Since then, outstanding debt has ballooned 4,411 percent to $18 trillion—more than twice the amount of all the gold in the world. Such massive debt levels can be reached only in a fiat currency system, where money is easy, virtually limitless and unsecured by anything tangible.
Below, you can see how dramatically all debt in the U.S., both public and private, has been allowed to soar past economic growth since the end of the gold standard.
The $200 Trillion Question
 So how would any of this debt ever be settled were it called in tomorrow? The U.S. currently holds “only” 8,133.5 tonnes of gold in its reserves, a significant decline from the all-time high of over 20,000 tonnes in the 1950s. This amount calculates to about $340 billion—nothing to sneeze at, but a far cry from the current U.S. debt level. So how would any of this debt ever be settled were it called in tomorrow? The U.S. currently holds “only” 8,133.5 tonnes of gold in its reserves, a significant decline from the all-time high of over 20,000 tonnes in the 1950s. This amount calculates to about $340 billion—nothing to sneeze at, but a far cry from the current U.S. debt level.
This is the case in other nations as well. As you can see, Japan is one of the top holders of gold, but at 400 percent, its debt-to-GDP ratio is higher than any other country’s in the world.
Lately we’ve seen several central banks repatriate more of their gold reserves from foreign vaults, most notably Germany, Austria, France, Switzerland and others. Texas is even in the early stages of creating its own gold depository, the first to be run by a state. The fact that central banks still hold the metal has less to do with “tradition”—as former Federal Reserve Chair Ben Bernanke put it during a Congressional hearing in 2011—and more to do with confidence in gold’s enduring power.
It’s unlikely that gold will ever reach $33,900 per ounce—or even $12,000, as investing expert James Turk calculates—but the fact that supply has not kept up with debt levels suggests that prices might very well rise.
Gold’s Late Summer Rebound Trend
A new report by Bank of America Merrill Lynch shows that since 2001, bullion has reached a bottom between mid-June and mid-July and rebounded thereafter. In all but two of the last 27 years, or 93 percent of the time, gold and gold equities enjoyed a late summer rally, thanks in large part to the approaching Indian festival and wedding seasons.
This helps confirm what I often write and speak about, that gold prices have historically followed seasonality trends for the five-, 15- and 30-year periods. You can see how gold troughed between June and July and then rose in anticipation of Diwali and the wedding season.
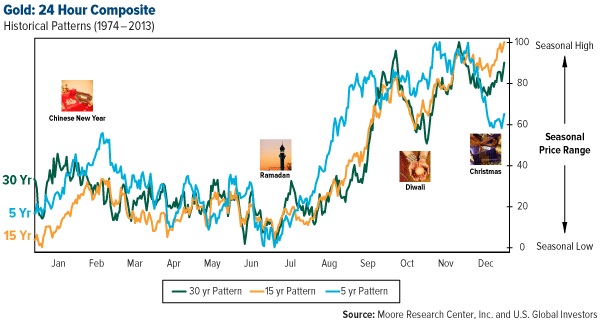
According to BofA Merrill Lynch, from 2001 to 2014, the yellow metal gained 14.9 percent on average between mid-summer and mid-autumn.
Gold’s Summer Seasonal Rallies
| Year
| Start Date
| Gold Price per Ounce
| End Date
| Gold Price per Ounce
| Percent Change in Gold Price
| 2001
| July 30
| $265
| September 28
| $293
| 10.6%
| 2002
| July 29
| $303
| September 24
| $326
| 7.8%
| 2003
| July 16
| $344
| September 24
| $389
| 13.2%
| 2004
| August 12
| $394
| November 22
| $499
| 14.0%
| 2005
| July 14
| $420
| September 21
| $472
| 12.6%
| 2006
| July 14
| $560
| August 9
| $650
| 16.1%
| 2007
| June 12
| $647
| September 2
| $734
| 13.4%
| 2008
| August 15
| $786
| October 9
| $913
| 16.3%
| 2009
| July 8
| $910
| October 13
| $1,064
| 17.0%
| 2010
| July 27
| $1,157
| November 9
| $1,393
| 20.4%
| 2011
| July 1
| $1,487
| September 5
| $1,900
| 27.8%
| 2012
| July 12
| $1,572
| October 4
| $1,790
| 13.9%
| 2013
| June 27
| $1,201
| August 28
| $1,418
| 18.1%
| 2014
| June 2
| $1,244
| July 11
| $1,339
| 7.6%
| Average
|
|
|
| $937.89
| 14.9%
|
Source: Bloomberg, BofA Merrill Lynch Global Research, U.S. Global Investors |


