SI
SI
discoversearch

We've detected that you're using an ad content blocking browser plug-in or feature. Ads provide a critical source of revenue to the continued operation of Silicon Investor.  We ask that you disable ad blocking while on Silicon Investor in the best interests of our community.  If you are not using an ad blocker but are still receiving this message, make sure your browser's tracking protection is set to the 'standard' level.
Technology Stocks : Daily Technical Analysis (Elliotwave)

 Public ReplyPrvt ReplyMark as Last ReadFilePrevious 10Next 10PreviousNext  
From: more10012/1/2015 5:37:29 AM
   of 37
 
The 5 Largest Companies:

AAPL $GOOGL GOOG $MSFT XOM $BRK.A BRK.B


Today I wanted to use Barchart to find the 5 largest stocks by market capital and found that 2 in the top 5 had 2 classes of shares.


The stocks featured today are Apple (AAPL), Alphabet (GOOGL), Alphabet Class C (GOOG), Microsoft (MSFT), Exxon Mobil (XOM), Berkshire Hathaway B (BRK.B) and Berkshire Hathaway A (BRK.A).


Apple (AAPL)


Barchart technical indicators:

Market Cap $673.72 billion

56% Barchart technical buy signals

Trend Spotter hold signal

Above its 20, 50 and 100 day moving averages

3 new highs but down .97% for the month

Relative Strength Index 53.64%

Barchart computes a technical support level at 117.13


Recently traded at 118.29 with a 50 day moving average of 115.23

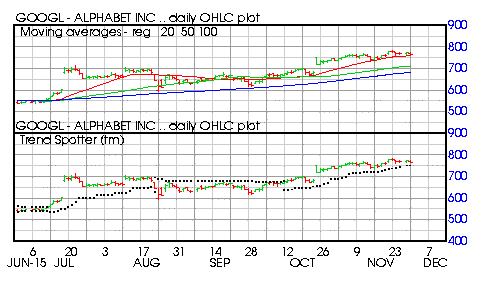
Alphabet (GOOGL)


Barchart technical indicators:

Market Cap $527.04 billion

56% Barchart technical buy signals

Trend Spotter buy signal

Above its 20, 50 and 100 day moving averages

7 new highs and up 3.86% for the last month

Relative Strength Index 60.72%

Barchart computes a technical support level at 763.99


Recently traded at 764.05 with a 50 day moving average of 711.28

Alphabet C (GOOG)


Barchart technical indicators:

Market Cap $ 514.52 billion

80% Barchart technical buy signals

Trend Spotter buy signal

Above its 20, 50 and 100 day moving averages

9 new highs and up 5.06% for the last month

Relative Strength Index 63.87%

Barchart computes a technical support level at 744.47


Recently traded at 744.53 with a 50 day moving average of 684.55

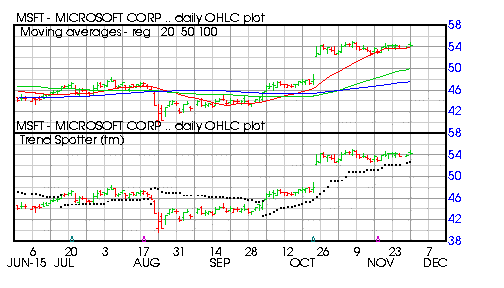
Microsoft (MSFT)


Barchart technical indicators:

Market Cap $428.87 billion

80% Barchart technical buy signals

Trend Spotter buy signal

Above its 20, 50 and 100 day moving averages

4 new highs and up 3.12% in the last month

Relative Strength Index 62.47%

Barchart computes a technical support level at 53.64


Recently traded at 54.09 with a 50 day moving average of 50.00

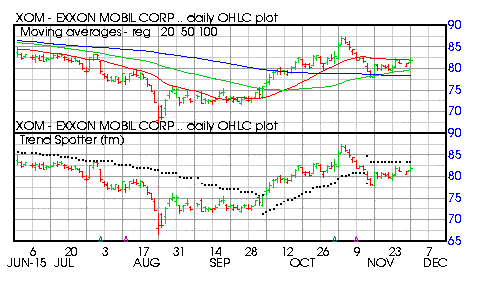
Exxon Mobil (XOM)


Barchart technical indicators:

Market Cap $338.24 billion

48% Barchart technical buy signal

Trend Spotter sell signal

Below its 20 day moving average buy above its 50 and 100 day moving averages

Down .77% in the last month

Relative Strength Index 53.58%

Barchart computes a technical support level at 80.18

Recently traded at 81.91 with a 50 day moving average of 79.73

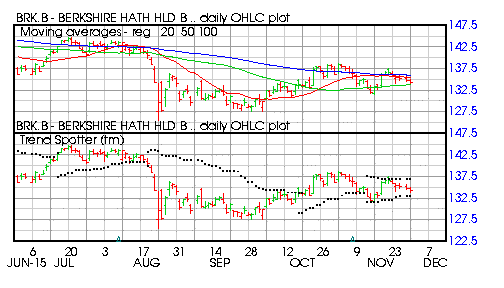
Berkshire Hathaway B (BRK.B)


Barchart technical indicators:

Market Cap $333.10 billion

24% Barchart technical sell signals

Trend Spotter hold signal

Below its 20 day moving average but above its 50 and 100 day moving averages

Down 1.11% for the last month

Relative Strength Index 47.58%

Recently traded at 134.38 with a 50 day moving average of 131.81


Berkshire Hathaway A (BRK.A)


Barchart technical indicators:

Market Cap $332.35 billion

24% Barchart technical sell signals

Trend Spotter hold signal

Below its 20 day moving average but above its 50 and 100 day moving averages

Down 1.45% in the last month

Relative Strength Index 48.24%


Recently traded at 201,407.00 with a 50 day moving average of 200,765.16
Report TOU ViolationShare This Post
 Public ReplyPrvt ReplyMark as Last ReadFilePrevious 10Next 10PreviousNext