SI
SI
discoversearch

We've detected that you're using an ad content blocking browser plug-in or feature. Ads provide a critical source of revenue to the continued operation of Silicon Investor.  We ask that you disable ad blocking while on Silicon Investor in the best interests of our community.  If you are not using an ad blocker but are still receiving this message, make sure your browser's tracking protection is set to the 'standard' level.
Technology Stocks : Daily Technical Analysis (Elliotwave)

 Public ReplyPrvt ReplyMark as Last ReadFilePrevious 10Next 10PreviousNext  
From: more10012/2/2015 4:03:32 AM
   of 37
 
FNMFN GROC SCMR TKOI sell signals --

FNMFN $GROC SCMR $TKOI


Yesterday I deleted Federal National Mortgage Association (FNMFN), Gradac Favro AD Kladoro (GROC), Sycamore Networks (SCMR) andTelkonet (TKOI) from the Barchart Van Meerten Speculative portfolio for negative price momentum.


The portfolio contains stocks priced below $10 a share that are hitting new highs and trading above their 20, 50 and 100 day moving averages.


Federal National Mortgage Association (FNMFN)


Barchart technical indicators:

64% Barchart technical sell signals

Trend Spotter sell signal

Trading below its 20, 50 and 100 day moving averages

22.42% off its recent high

Relative Strength Index 35.77%

Recently traded at 7.5000 which is below its 50 day moving average of 8.7510

Gradac Favro AD Kladoro (GROC)


Barchart technical indicators:


64% Barchart technical sell signals

Trend Spotter sell signal

Below its 20, 50 and 100 day moving averages

73.49% off its recent high

Relative Strength Index 36.92%

Recently traded at .0057 which is below its 50 day moving average of .0104


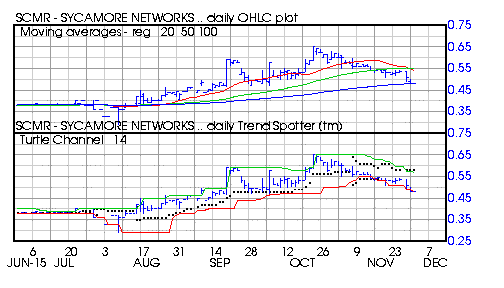
Sycamore Networks (SCMR)


Barchart technical indicators:

64% Barchart technical sell signals

Trend Spotter sell signal

Below its 20, 50 and 100 day moving averages

26.59% off its recent high

Relative Strength Index 31.68%

Recently traded at .4900 which is below its 50 day moving average of .5484


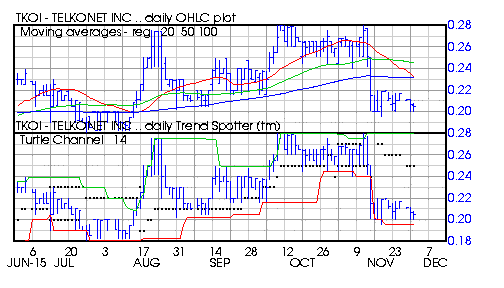
Telkonet (TKOI)


Barchart technical indicators:

64% Barchart technical sell signals

Trend Spotter sell signal

Below its 20, 50 and 100 day moving averages

26.79% off its recent high

Relative Strength Index 35.82%


Recently traded at .2050 which is below its 50 day moving average of .2456
Report TOU ViolationShare This Post
 Public ReplyPrvt ReplyMark as Last ReadFilePrevious 10Next 10PreviousNext