 |
 |  |
| We've detected that you're using an ad content blocking browser plug-in or feature. Ads provide a critical source of revenue to the continued operation of Silicon Investor. We ask that you disable ad blocking while on Silicon Investor in the best interests of our community. If you are not using an ad blocker but are still receiving this message, make sure your browser's tracking protection is set to the 'standard' level. |
| Politics : Formerly About Advanced Micro Devices |
| Public ReplyPrvt ReplyMark as Last ReadFile | Previous 10Next 10PreviousNext |
| ||||||||||||||||||||||||||||||||||||||||||||||||||||||||||||||||||||||||||||||||||||||||||||||||||||
| ||||||||||||||||||||||||||||||||||||||||||||||||||||||||||||||||||||||||||||||||||||||||||||||||||||
| Public ReplyPrvt ReplyMark as Last ReadFile | Previous 10Next 10PreviousNext |
| Home | Hot | SubjectMarks | PeopleMarks | Keepers | Settings |
| Terms Of Use | Contact Us | Copyright/IP Policy | Privacy Policy | About Us | FAQ | Advertise on SI |
| © 2026 Knight Sac Media. Data provided by Twelve Data, Alpha Vantage, and CityFALCON News |


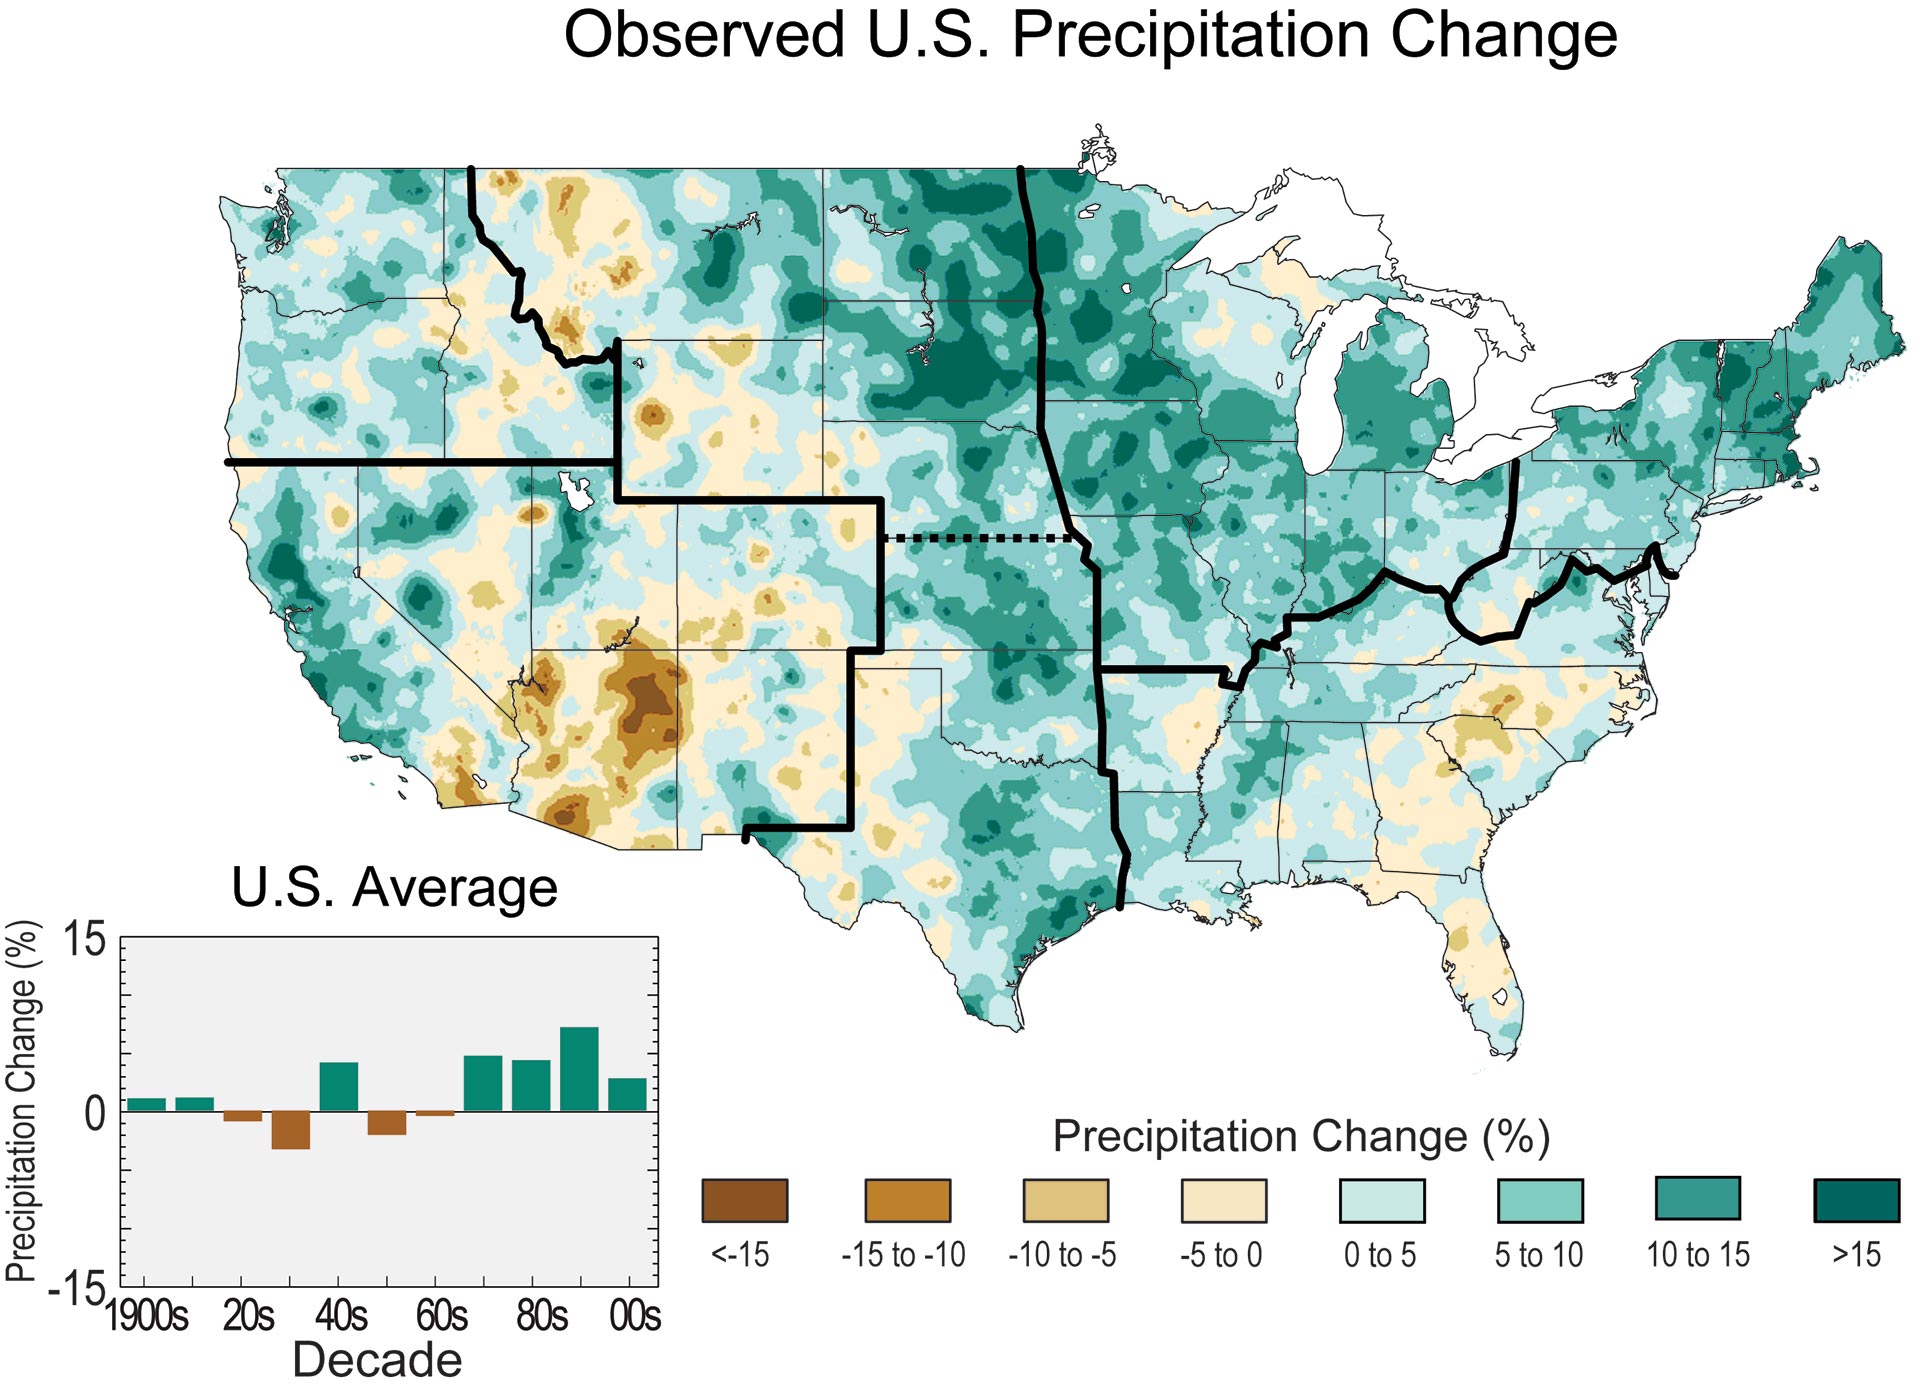
 Caption: The colors on the map show annual total precipitation changes for 1991-2012 compared to the 1901-1960 average, and show wetter conditions in most areas. The bars on the graph show average precipitation differences by decade for 1901-2012 (relative to the 1901–1960 average). The far right bar is for 2001-2012. (Figure source: NOAA NCEI / CICS-NC).