| | | Monday Morning Outlook, by Todd Salamone
HOW TO PLAY THIS BUYING OPPORTUNITY
The 10-day, equity-only, buy-to-open put/call volume ratio has just rolled over from a multi-year high
Stocks quoted in this article:
RUT| VIX| QQQ| SPY
2/1/2016 9:22 AM
http://www.schaeffersresearch.com/content/analysis/2016/02/01/how-to-play-this-buying-opportunity
excerpt:
"Last week, we also discussed the SPY's 36-month (three-year) moving average, currently situated around the 190 strike. As we move into this week's trading following an advance from the 2014-2015 lows, we are at an important juncture … A monthly close above this trendline would likely indicate that we are only in the throes of another correction, with a potential run to previous highs a strong possibility in the months ahead. But a close significantly below this moving average would likely indicate increasing risk that the 2014-2015 lows will be taken out."
--Monday Morning Outlook, January 25, 2016
After a Fed meeting last week and the release of fourth-quarter gross domestic product (GDP) numbers that met lowered expectations on Friday, the broad market rallied on the heels of a weak start. More importantly, the SPDR S&P 500 ETF Trust (SPY - 193.72) closed January above its 36-month (three-year) moving average, which we viewed as a potential technical marker that the worst is over, at least for the time being.
The SPY's January price action is similar to both August 2011 and August 2015, which we have referenced before. In August 2011, the SPY violated the key 36-month moving average intra-month, but a close above it at month's end preceded a strong rally that eventually took out old highs. This low occurred as panicky investors sold stocks after a credit-rating agency downgraded U.S. debt. Now, investors are assessing many risk factors, including the impact of lower energy prices, a slowdown in China, and what the Fed's next move will be in the midst of decelerating economic growth.
[....]
Another sentiment indicator that bulls should welcome is the weekly National Association of Active Investment Managers (NAAIM) survey, which attempts to quantify the equity allocation among investment managers surveyed. After reducing allocations since early December from mid-range levels, it appears this group is shopping equities at present -- but remain relatively underweight. Per the chart below, attractive buying opportunities have historically occurred when this group begins increasing allocations from low levels, which appears to be the case now.
NAAIM survey – increasing equity allocations from underweight position
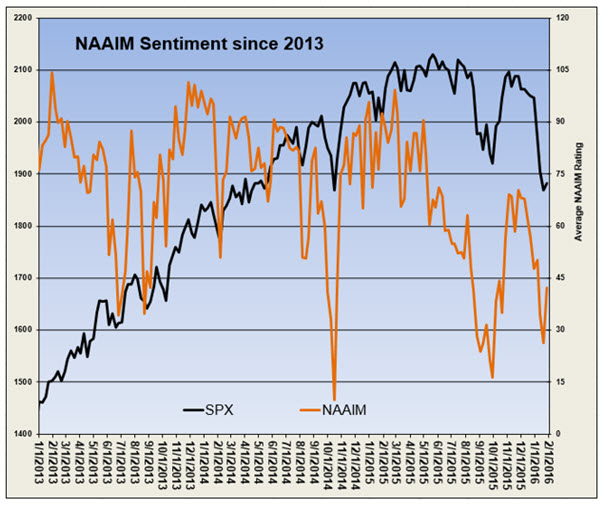
The bottom line is that short-term negative sentiment appears to have run its course, and with multiple indexes holding at longer-term support -- recovering from an apparent sell-off exaggerated by January expiration -- equity markets should advance in the coming weeks.
SPY and/or PowerShares QQQ Trust (QQQ - 104.13) call options are one way to play a rally on mild pullbacks, as options allow you to reduce your capital outlay amid the various risk factors overhanging equities. However, all bets are off if the QQQ falls below $100 or if the SPY moves below $189.
more at the link |
|


