What would OBL make of this?
Record lower troposphere temperatures are feeling El Niño
Sou | 3:45 PM
According to the latest UAH temperature data, the lower troposphere is feeling the effect of El Niño, as expected. This latest month (February) the anomaly was 0.83 °C (1.5 °F) above the 1981-2010 average. Think about that. The average of 1981 to 2010 is taken as zero, and the temperature for February was 0.83 °C above that. That's huge, even for an El Niño. This is the largest monthly anomaly in the UAH record.
The chart below shows the annual average lower troposphere temperature to 2015, with the February anomaly shown as a line at the top.
 | | Figure 1 | Lower troposphere temperature changes from 1979 to 2015. The chart shows the annual average temperature anomaly with the anomaly for February 2016. Data sources: UAH and Roy Spencer's blog |
This next chart is for the month of February only, from February 1979 to February 2016:
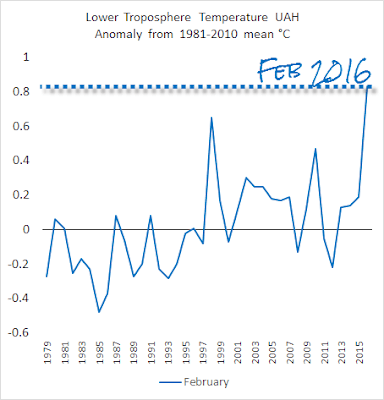 | | Figure 2 | Lower troposphere temperature changes from 1979 to 2015 for February only. Data sources: UAH and Roy Spencer's blog |
Tracking El Niño years
Next here is a chart showing selected recent El Niño years with the UAH lower troposphere data:
 | | Figure 3 | Lower troposphere temperature changes for selected El Nino years. Data sources: UAH and Roy Spencer's blog |
In the next couple of months the lower troposphere could even go a tad higher, going by past experience.
The chart below compares months from January 1979 through to February 2016, and includes a linear trend line for the whole period. As shown on the chart, the February anomaly is a bit higher than the previous highest anomaly, which was in April 1998.
 | | Figure 4 | Lower troposphere monthly temperature changes from January 1979 to February 2016. Data sources: UAH and Roy Spencer's blog |
Last month, after releasing the January data, Roy Spencer wrote on his blog:
We are now approaching peak warmth in the tropics due to El Nino conditions. Only time will tell if warming continues for a few more months, or whether January was the peak.That surprised me, because I thought he would have noticed that the lower troposphere could continue to get even warmer from February through to April. (He hasn't made any such statements this time around.)
Comparing the lower troposphere with the surface
The trend for the lower troposphere from January 1979 to February 2016 at 0.1 °C/decade is still lower than the rate of surface warming over almost the same period 0.14 °C/decade (minus one month - to January 2016). The chart below shows the difference in the trends. It's a bit messy because it's a monthly chart. The main thing I want to illustrate is the trend of each. They aren't hugely different, however one would have expected that the UAH trend would be higher, if anything.
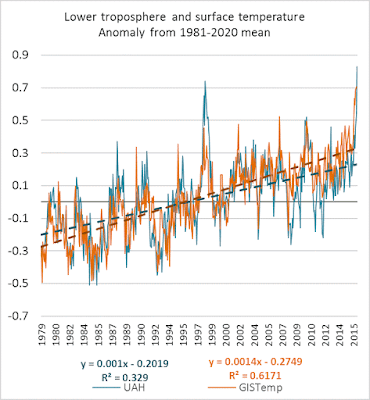 | | Figure 5 | Global temperature changes from January 1979 to February 2016 for the lower troposphere and from January 1979 to January 2016 for the surface. Data sources: UAH and Roy Spencer's blog and GISS NASA |
As remarked upon in other articles (and elsewhere), the lower troposphere temperatures diverged from those of the surface earlier this century.
Where the differences lie in the lower troposphere
If you want to explore a bit further, most of the recent increase is in the northern hemisphere. Below is a chart showing the annual average for the northern hemisphere only (1979 to 2015), with February 2016 shown as a line. The February anomaly is 1.17 C or 2.1 F above the 1981 to 2010 mean.
 | | Figure 6 | Lower troposphere temperature changes from 1979 to 2015 for the northern hemisphere. The chart shows the annual average NH temperature anomaly with the NH anomaly for February 2016. Data sources: UAH and Roy Spencer's blog |
Compare that with the tropics, where the February anomaly is 0.99 C or 1.78 F above the 1981-2010 average.
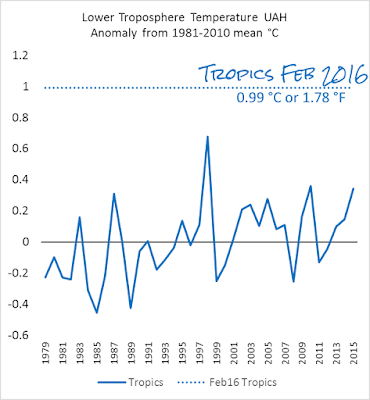 | | Figure 7 | Lower troposphere temperature changes from 1979 to 2015 for the tropics. The chart shows the annual average temperature anomaly in the tropics with the tropics anomaly for February 2016. Data sources: UAH and Roy Spencer's blog |
Then the southern hemisphere, where the February anomaly is 0.5 C or 0.9 F above the 1981 to 2010 average.
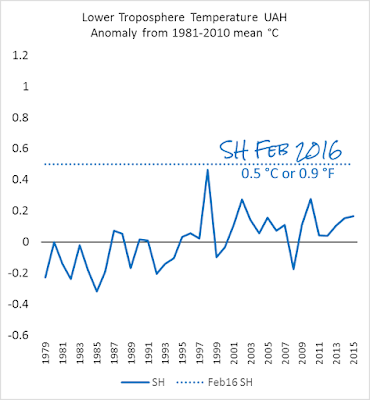 | | Figure 8 | Lower troposphere temperature changes from 1979 to 2015 for the southern hemisphere. The chart shows the annual average SH temperature anomaly with the SH anomaly for February 2016. Data sources: UAH and Roy Spencer's blog |
It strikes me that the temperature changes in the lower troposphere are not inconsistent with the large surface warming in the Arctic, which along with the El Niño surface warming in the tropics, could be contributing to the lower troposphere anomaly in the northern hemisphere.
Roy Spencer wrote on his blog:
The February warmth is likely being dominated by the warm El Nino conditions, which tends to have peak warmth in the troposphere close to February…but it appears that isn’t the whole story, since the tropical anomaly for February 2016 (+0.99 C) is still about 0.3 C below the February 1998 value during the super-El Nino of that year. In addition to the expected tropical warmth, scattered regional warmth outside the tropics led to a record warm value for extratropical Northern Hemispheric land areas, with a whopping +1.46 C anomaly in February…fully 0.5 deg. C above any previous monthly anomaly (!):
blog.hotwhopper.com |


