Stock Market Picture
It is a mixed bag guys. I think we go higher but likely partly through a gap.
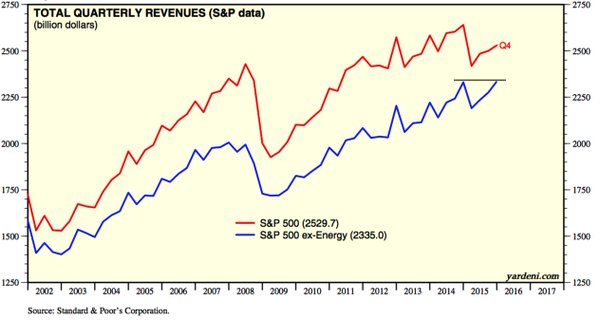
As I have posted here before, economy is really not so bad. Revenues ex-energy just reached an all time high per Fat Pitch, from a source I have used often in the past.
twitter.com

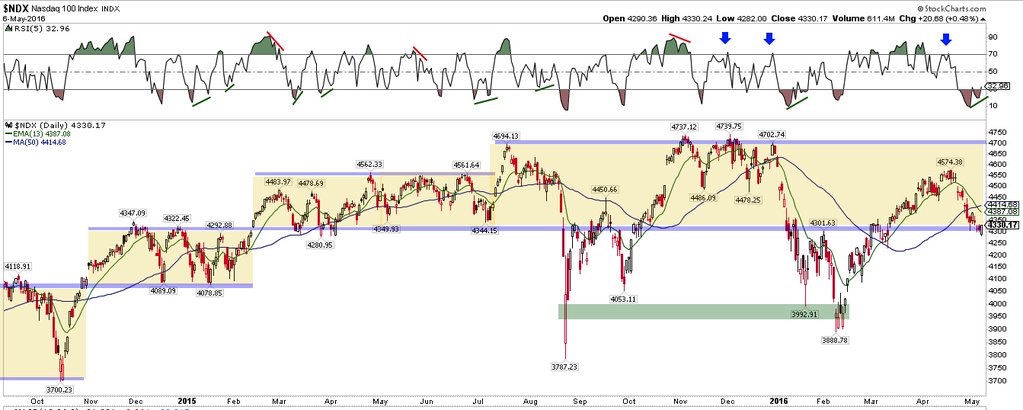
Nazz looks kinda bullish, again from Fat Pitch. twitter.com

Fat Pitch notes good risk reward to take a trade here now. 1% down vs 2+% up.
Elliott Wave:
- David Starr bullish but admits we could change quickly. New lows and ATH on table.
- Prechter uber bearish but up ST with quickie low into Monday. 50-60% bearish btw. worldcyclesinstitute.com
- OEW now bearish on all timeframes. caldaro.wordpress.com
- http://practicaltechnicalanalysis.blogspot.hk/2016/05/weekly-preview.html is bullish into bearish into bullish.
- Avi Gilburt - who knows really? See below or link: marketwatch.com
Nothing has changed our overall expectations, as the market has dropped this past week as we wanted to see. The question now is where it finds support. Ideally, the 2027-2040SPX region should provide support if this is indeed a wave iv in a larger wave (1) off the lows. I will be looking for an impulsive structure taking us through 2080SPX to suggest that we are on our way to the 2131-2165SPX higher target for wave v.
Alternatively, it would take a break of 2027, with follow through below 2008SPX to place me into the wave (2) count, with the alternative being primary wave 4 taking us down to the 1700 region.
I also want to remind you that most long-term investors should be waiting for the breakout signal we have previously discussed before you trade the upside to 2500-plus aggressively. We need to complete wave (1) off the February lows, followed by a corrective wave (2) retrace, and then break back out over the top of wave (1) sometime this summer, or even early fall. That is the signal that the market is heading to 2500-plus going into the year 2017. Until such time, one must still maintain caution as the potential still exists for the drop to the 1700s before that rally to 2500-plus begins in earnest.
Seasonals
We have seasonals strongest Monday but strong all week.
jeffhirsch.tumblr.com
But Almanac Trader is decidedly not very upbeat overall.
jeffhirsch.tumblr.com
BUT go with direction of gap on Monday regardless.
investiquant.com
Other cycle stuff:
This guy is bullish. I disagree on his European view as DAX looks bad to me.
blog.smartmoneytrackerpremium.com
Fibqueen is kinda bullish but always chart dependent. She does think FEB may have been a major low still. She had timing at low Friday. This is a screenshot from her free video. She has been a bit wrong on bios although they never triggered a buy signal at her possible lows, with exception of IBB.

Tom Aspray, as mentioned in last post is bullish, unless we go down. Correction may be done.
forbes.com
Sectors
- Energy looking weaker. See Message 30570044
- Biotechs looking for re-touch of lows? It has possible earlier turn points but momentum is horrible. Down in runaway fashion for 2-3 weeks with brief 1 day respites. I will have my usual XBI graphics up tomorrow.
- Banks dreadful. Allstarstocks is shorting KRE from public twitter feed.
- Metals looking tired and gold/silver often down horribly from May to July. I had graphics but cannot find at moment.
- Tech very tired EXCEPT FANG ignited Friday.
- Industrials must be getting tired.
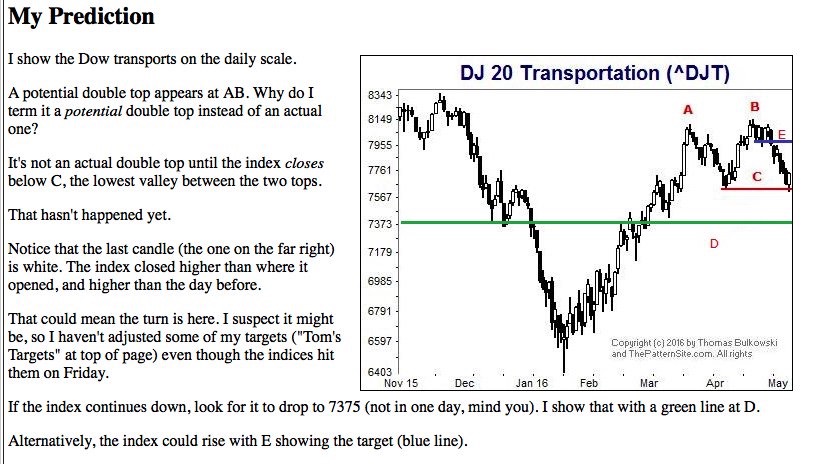
- Transports at key decision point. Looks good so far.
twitter.com

Tidbits
China oil production is weak leading to higher import demand.
bit.ly
An old friend, THE gweilo China expert, thinks commodity demand is NOT coming back and Chinese have a debt issue that is maturing - Patrick Chovanec on twitter.
Tech bubble? Yes in unicorns. Yes in China? No in public mkt. valuewalk.com
More flash crash issues to come?
bloomberg.com
Jon |


