"The actual prediction from Maslowski's 2009 publication is, "Autumn could become near ice free between 2011 and 2016."
Arctic Sea Ice gone by September 2016?

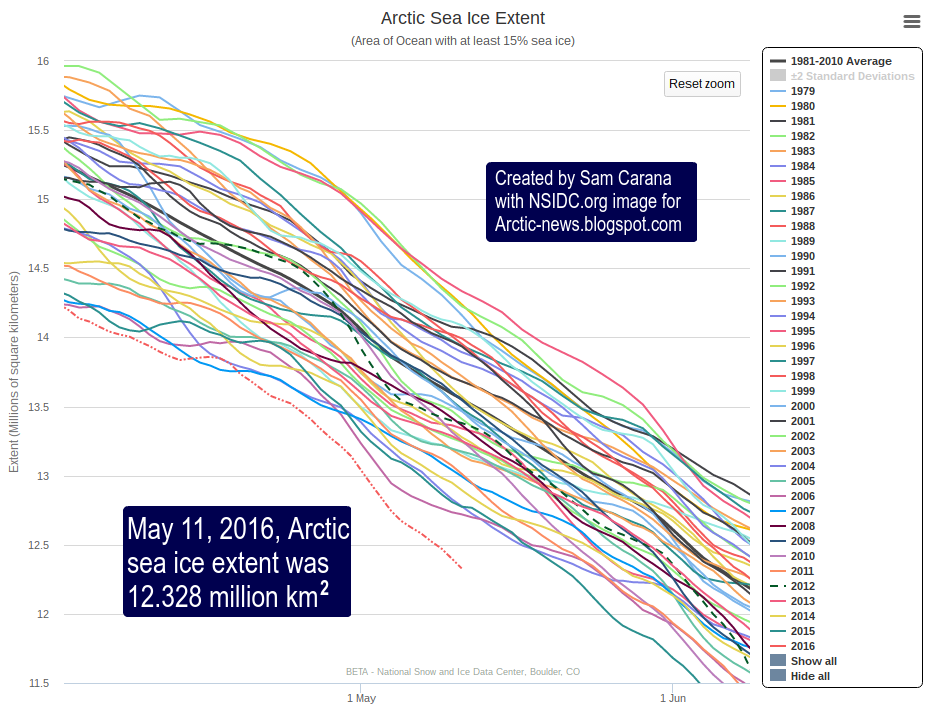
Above image shows that Arctic sea ice extent is very low, much lower than it was in other years at this time of year. On May 11, 2016, Arctic sea ice extent was 12.328 million square km.
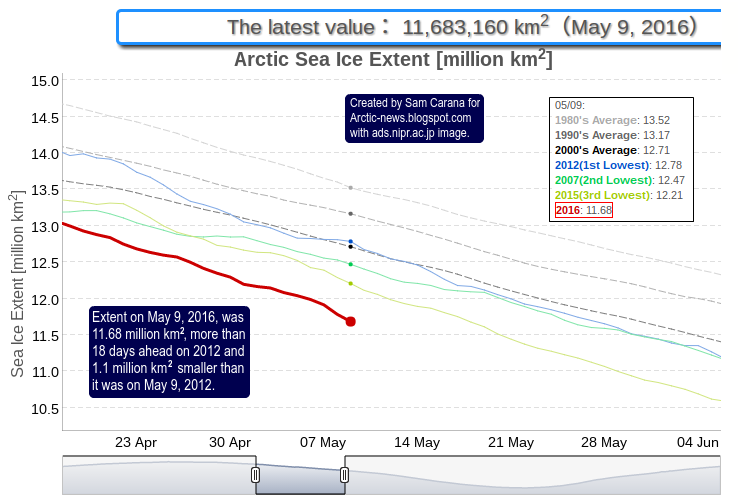
 | | [ based in image from JAXA ] |

Above image shows that Arctic sea ice extent on May 9, 2016, was 11.68 million square km, more than 18 days ahead on 2012 and 1.1 million square km smaller than it was on May 9, 2012.
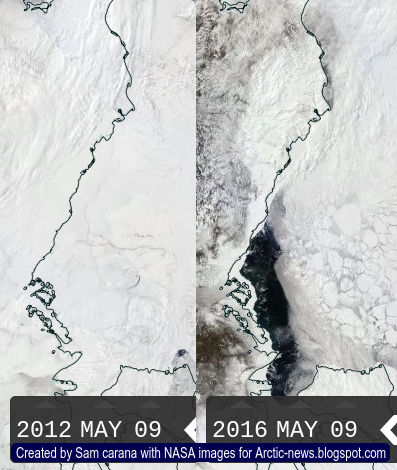
The image on the right compares the Beaufort Sea and the northern part of Alaska between May 9, 2012 and May 9, 2016. As the image illustrates, there now is a lot less ice and snow cover than there was on 2012.
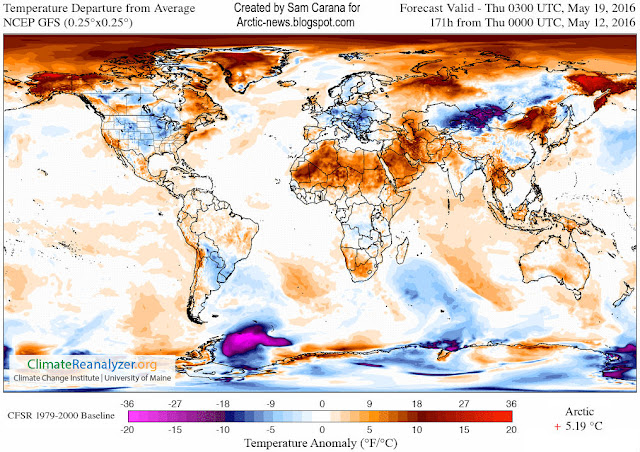
The situation looks set to deteriorate further over the coming months. The image below shows temperature forecast to reach anomalies as high as 5.19°C or 9.34°F for the Arctic as a whole (forecast for May 19, 2016, 0300 UTC), with temperature anomalies at the top end of the scale forecast for Alaska and eastern Siberia.
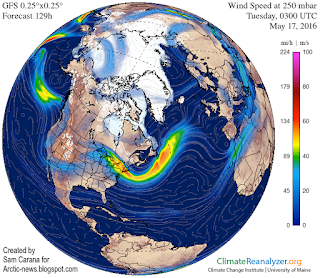
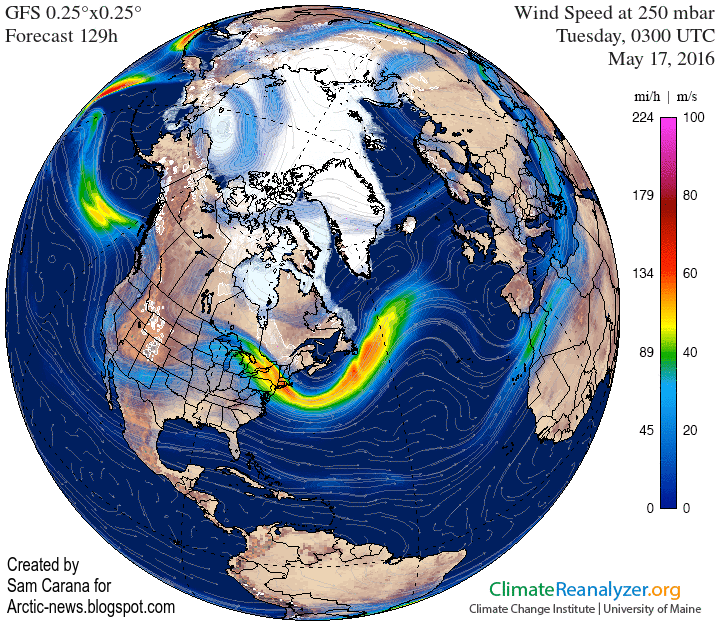
These temperature anomalies go hand in hand with a very wavy jet stream, as illustrated by the image on the right, showing loops extending all the way over the Arctic Ocean (in particular over the Beaufort Sea), taking along warm air in their path.
At the same time, the jet stream can extend far south at other places, making that cold air is moving south, out of the Arctic.
The result is a rapidly warming Arctic, which in turn makes the jet stream even more wavier, as one out of numerous feedbacks that are all hitting the Arctic at the same time.

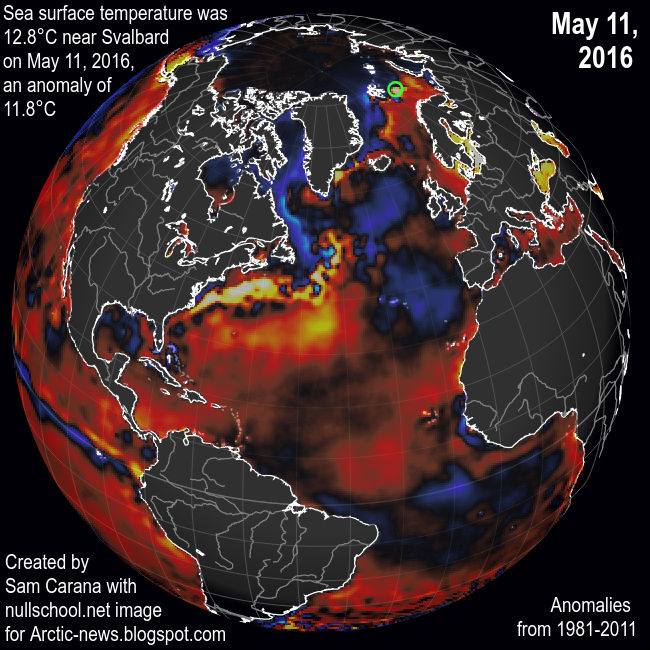
The image on the right shows that sea surface temperatures near Svalbard were as high as 55°F (12.8°C) on May 11, 2016, an anomaly of 21.2°F (11.8°C) from 1981-2011. In other words, the temperature of the sea surface was 1°C in that spot from 1981 to 2011, and now this spot is 11.8°C warmer.
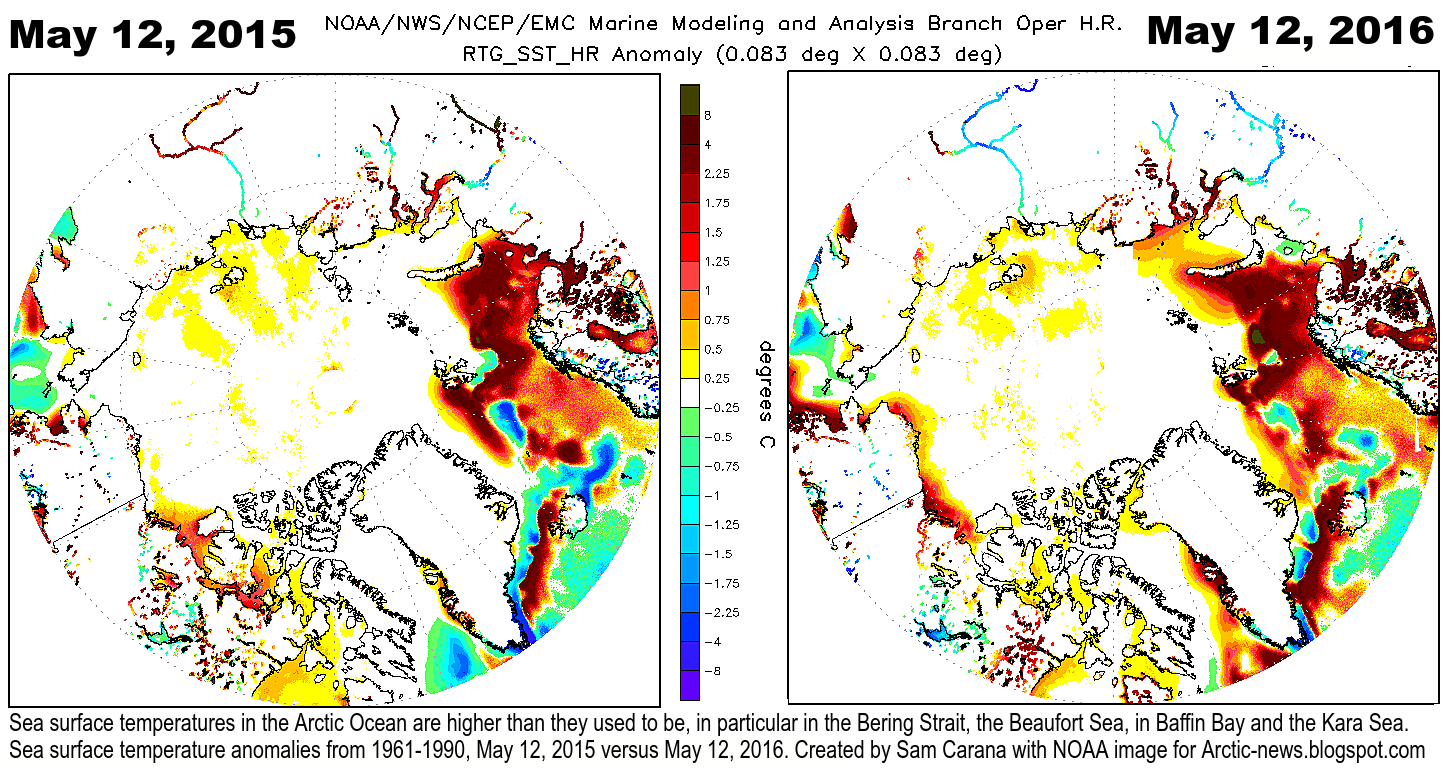
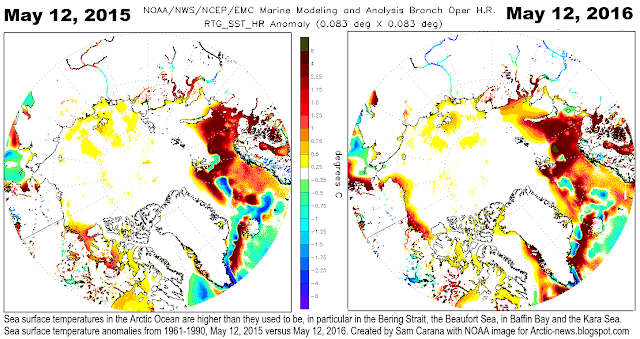
The image below compares sea surface temperature anomalies from 1961-1990 between May 12, 2015, and May 12, 2016.
Sea surface temperatures in the Arctic Ocean are higher than they used to be, in particular in the Bering Strait, the Beaufort Sea, in Baffin Bay and the Kara Sea.
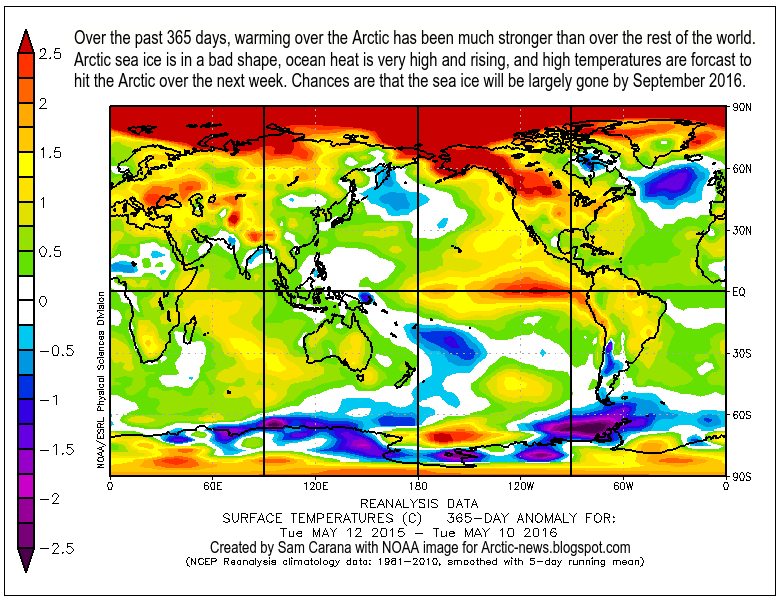
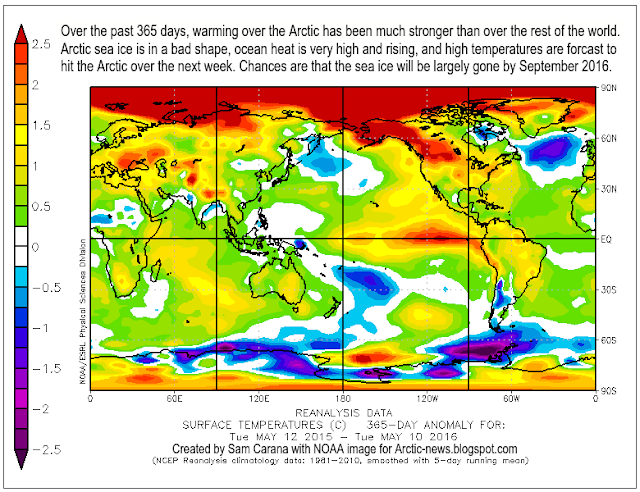
The image below shows that, over the past 365 days, warming over the Arctic have been much stronger than over the rest of the world. Air temperature anomalies of more than 2.5°C (4.5°F) show up over most of the Arctic Ocean. Furthermore, Arctic sea ice is in a bad shape, ocean heat is very high and rising, and high temperatures are forecast to hit the Arctic over the next week. Chances are that the sea ice will be largely gone by September 2016.
The situation is dire and calls for comprehensive and effective action, as described in the Climate Plan.
arctic-news.blogspot.com
=
Géd May 13, 2016 at 7:21 AM
How to explain this:
- May 9 : 11.683 millions km2
- May 11 : 12.328 millions km2
Different data sources or recovery between May 9 and 11?
Replies

Sam Carana May 13, 2016 at 6:56 PM
Yeah, there're using different satellites. Tamino recently discussed this here and here. |