S&P 500: Explosive 1995 Bull Market Showing Similarities To 2016
May 31, 2016 3:34 AM ET
Taylor Dart
Summary
The S&P 500 is 2% from an all-time high while bullish sentiment is at levels only seen 5 times the past 30 years.
Election years are seasonally extremely bullish and we are about to enter 3 of the 4 most bullish months during election years since 1900.
Despite pervasive chatter of a bubble, forward P/E ratios are only 0.5% above the average over the past 25 years.
The ominous head and shoulders pattern cited by bears has been negated, yet mutual fund outflows continued for another consecutive week.
----------------
The S&P 500 (NYSEARCA: SPY) had a strong week soaring over 2% higher and closing just 1 point shy of the psychological 2100 mark which the bears continue to cite as resistance. There have been several arguments this year for why not to trust this rally but as each argument becomes invalid, the bears continue to shrug them off and growl louder and louder. The first of the arguments was the small caps (NYSEARCA: IWM) were not leading (an apparent bearish tell), yet the small caps have gained 3.6% in April while the S&P 500 has paled in comparison gaining only 1.9%. So much for underperformance. The second argument was that the Nasdaq (NASDAQ: QQQ) was still in a bear market which was also negated this week when QQQ exploded through its 200-day moving average Tuesday, and closed the week 2% above that level. The third argument was that the banks were not participating and no real rally could take place without the financials. This argument went down the toilet as well this week as XLF closed the week above its 200-day moving average and at new 52-week highs. There is no end to the list of excuses as to why the market could not sustain this rally, yet all of them have been negated. Despite this, you don't see any bears wading out of the forest waving white flags to admit their defeat, or flipping bullish while we are still only up 2% for the year. The average bear is so used to the narratives of "crash," "down-trend" and "fear" this year that they can only see in one direction: bearish.
One of my favorite lines I've heard this year is "If the market goes any lower it's going to roll over quickly, but if it goes higher it is setting the perfect bull trap to suck everyone in so it can then begin its descent and inevitable crash." This is a perfect example of a perma-bear view where no matter what price does, the outcome must end in a crash type scenario. While these quotes and arguments may not provide a fair sample of investor sentiment on the stock market, I would argue the exact opposite. These views are evidenced by mutual fund outflows in 18 of the past 21 weeks, while the market has climbed substantially higher the past 15 weeks. These views are also evidenced by the comments section of my most recent SPY article written on April 29th titled "Why We Are Going To New Highs." The comments section of my article was absolutely littered with bears and it was almost impossible to find any bulls in sight, or even anyone willing to entertain the possibility of new highs. The market has since gained 2% from my article written while the index traded at 2059, yet sentiment has become even more bearish. I still believe new all-time highs are right around the corner and a breakout may be the final straw which results in the stubborn bears beginning to cover their shorts. For the bears sake, I hope I am right, as adding shorts into a new all-time high breakout is a recipe for financial disaster.
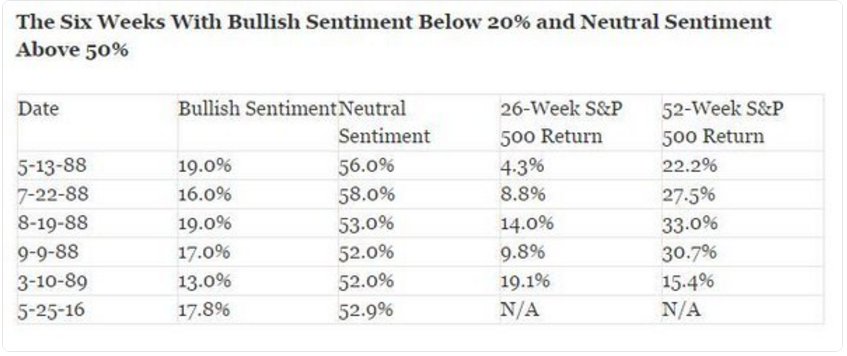
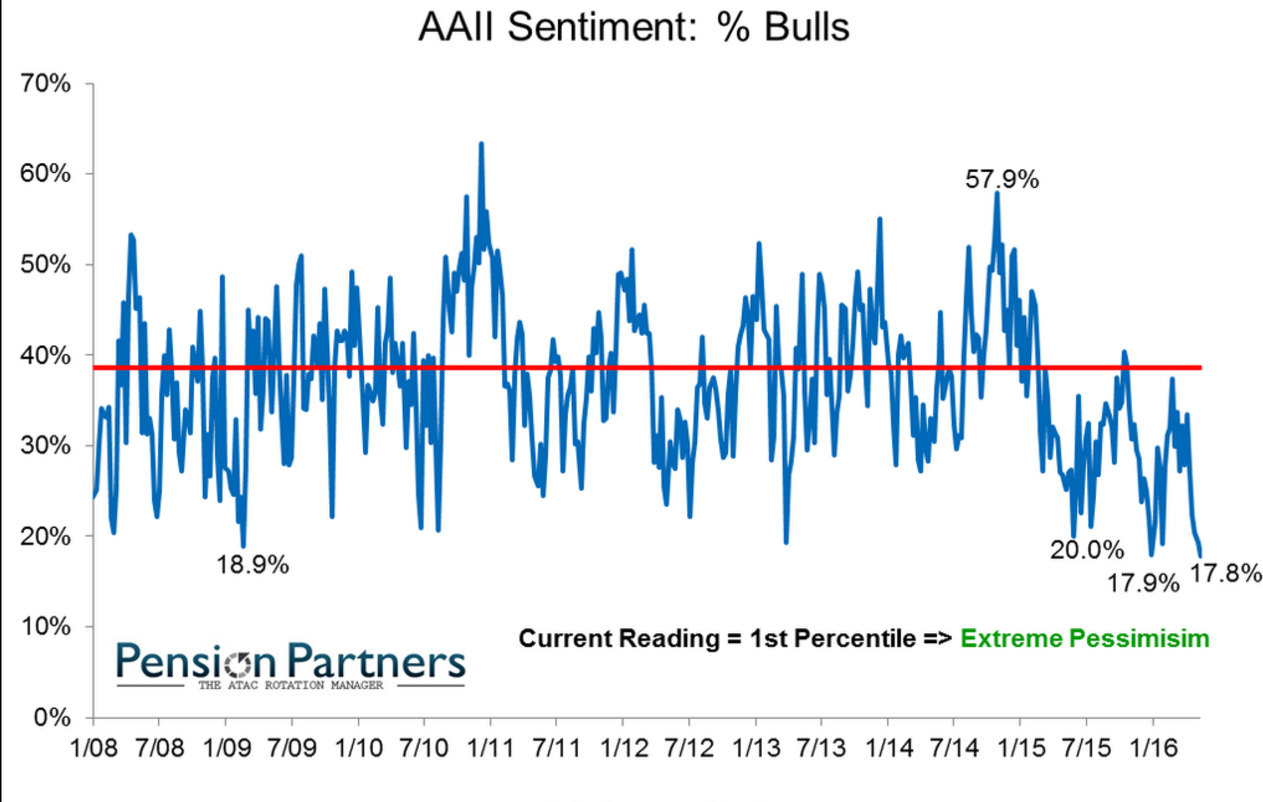
A Rare Event for Sentiment
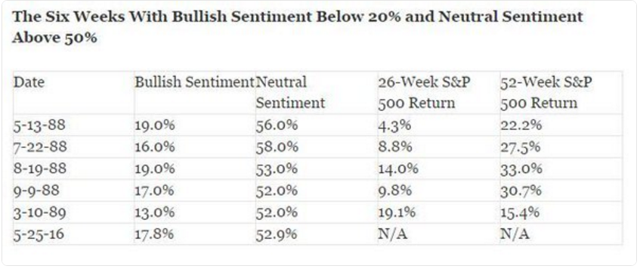
This week AAII investor sentiment did something it has only done 5 other times in the past 30 years. The weekly survey as of May 25th recorded a reading of bullish sentiment under 20%, while neutral sentiment is over 50%. These readings show that while over half of market participants surveyed are not sure about where the market is going, less than 18% of market participants believe we can go higher. Essentially that means that if you asked 1 in 5 investors if the market could go up, not even 1 of those 5 people would be willing to entertain the idea of higher prices. Looking back over previous readings the returns following periods of sentiment this poor are astronomical. The average 6-month return prior to this reading being recorded is 11.2%. A six-month return of 11.2% from Wednesday's closing price on the S&P 500 would put the index at 2309 by the end of November. The 1-year return is even more impressive with an average of 25.7% and a median value of 27.5%. Using the average return, this would place the S&P 500 at 2609 by June of next year. This rally would push forward P/E ratios to 20x from the current 16x and just over 1 standard deviation from the 20-year average.
Given the fact that the 2000 bubble peaked at a forward P/E of 27.2x, we would still be over 25% below bubble levels. While I am not saying I believe we are going to 2600 over the next 12 months, I am simply outlining the fact that anything is possible and history suggests we are going much higher based on current sentiment readings.
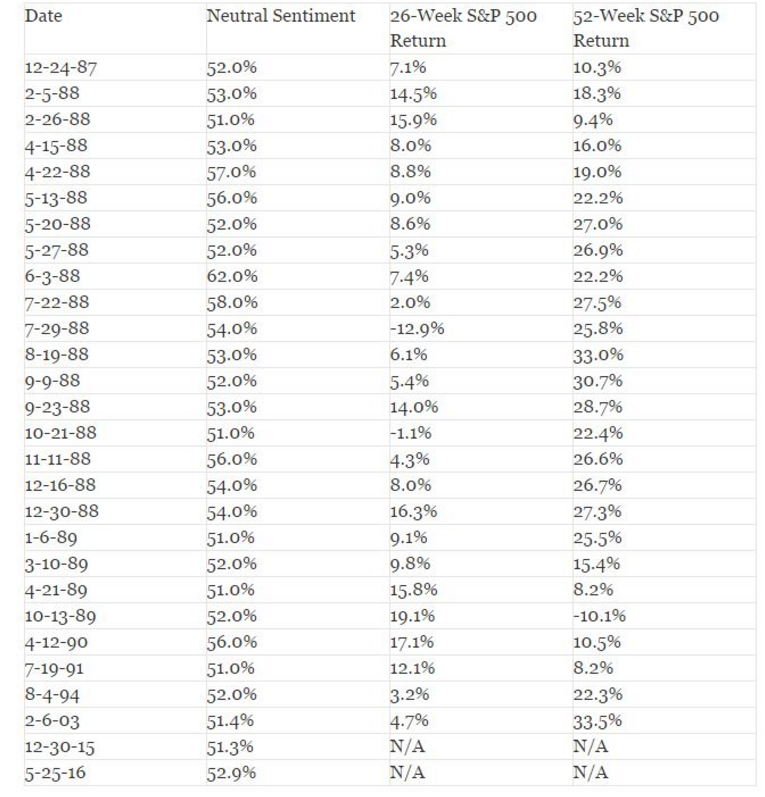
Looking at purely neutral readings of over 50.0%, we are now at the highest neutral reading in the past 25 years. The returns when removing bullish sentiment and tracking solely neutral sentiment are very similar and just as impressive. Out of 27 occurrence where neutral readings were above 50%, the 1-year return was negative is only one of those periods, or less than 5% of the time. Looking at the bullish reading alone, this is the lowest reading since 2005 and past recordings at these levels preceded large rallies. 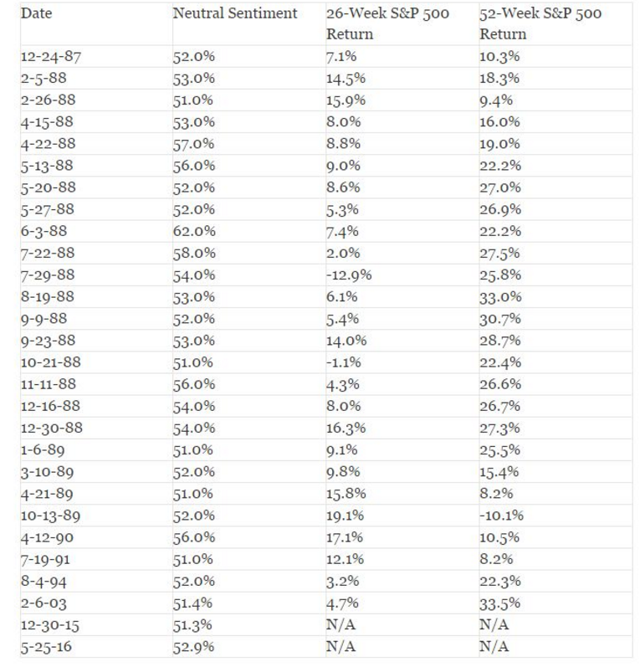
(click to enlarge) 
No Bubble Here
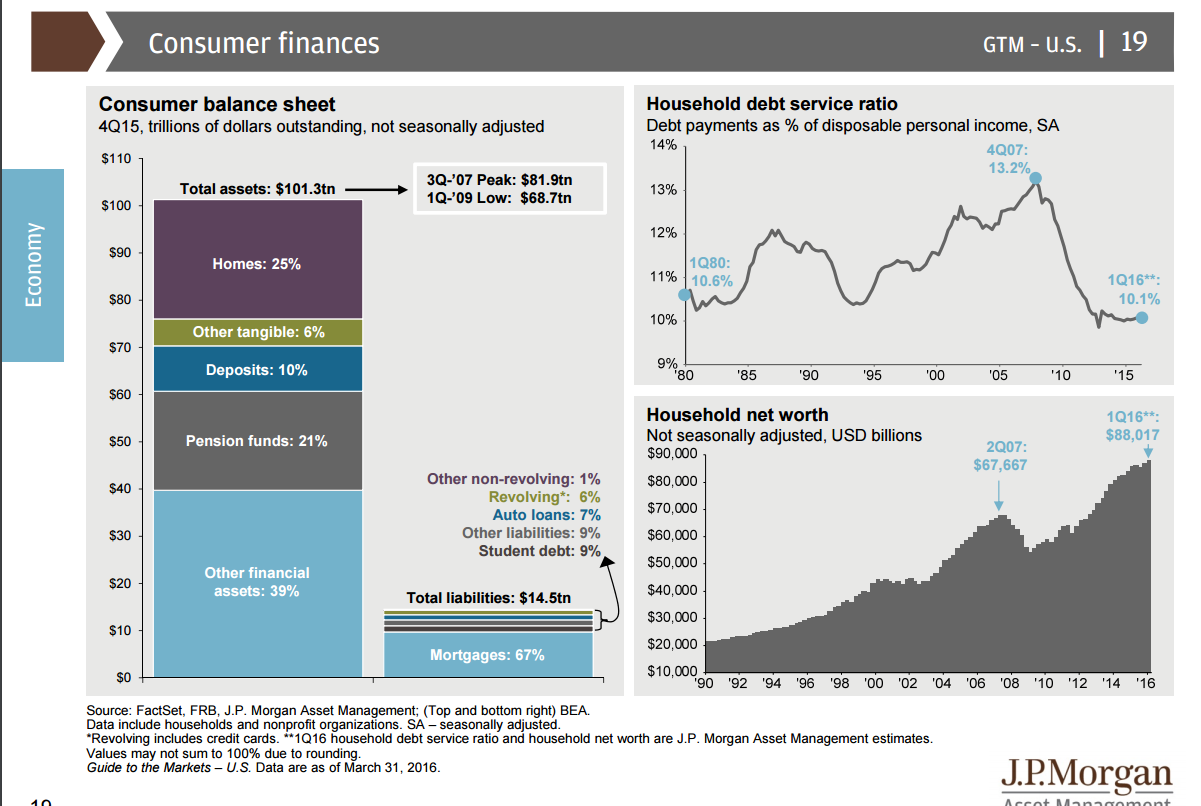
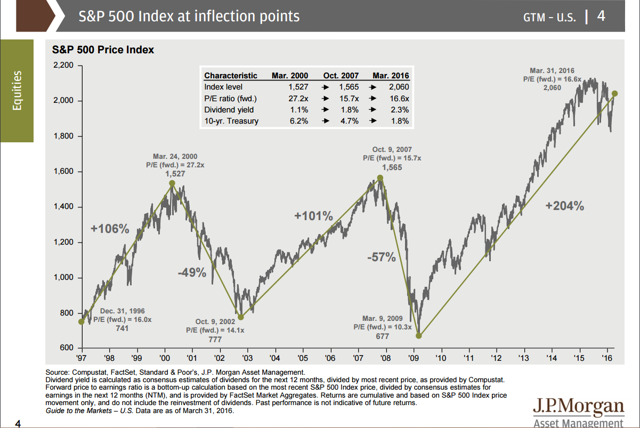
One of the arguments which consistently floats around is that we are in a bubble due to the massive rally which has taken place since 2009. While the market has rallied 190% over the past 7 years, several statistics shown by J.P. Morgan's latest report show that we are nowhere near a bubble.
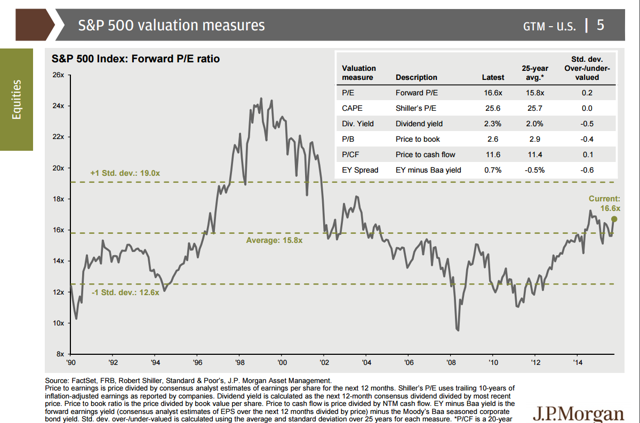
1. Earnings - Current forward earnings ratios are at 16.6x, compared to an average of 15.8 x over the past 25 years. A 0.2% standard deviation from the 25-year average is nowhere near "bubble" status. In addition, the 25-year average for dividend yields is 2% and we are currently sitting at 2.3%, meaning there is justification in paying 0.5% more for future earnings when you are receiving 15% more in yields for those earnings.
2. Housing - Housing starts are below the 20-year average, and more than 50% below 2006. These numbers are nowhere near bubble levels and show that we are actually in much better shape than the previous housing crisis.
3. Debt - Household net worth is currently 25% above 2007 levels and at the highest levels ever. In addition to this, household debt service is 25% below 2007 levels and the lowest in over 35 years.
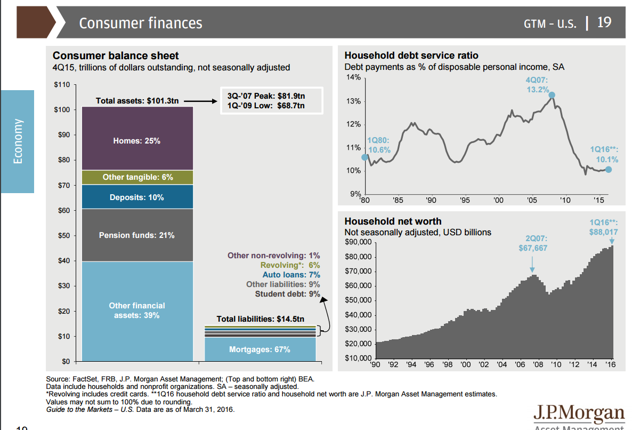
While the bears are constantly screaming about bubbles and unprecedented levels of debt and leverage, these above facts are anything but bearish and show we are in much better shape than we are previous to the 2008 market crash.
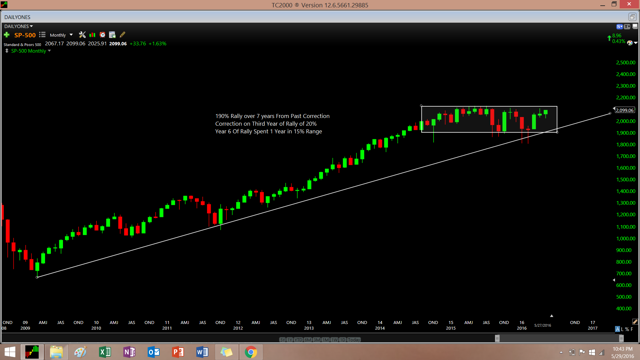
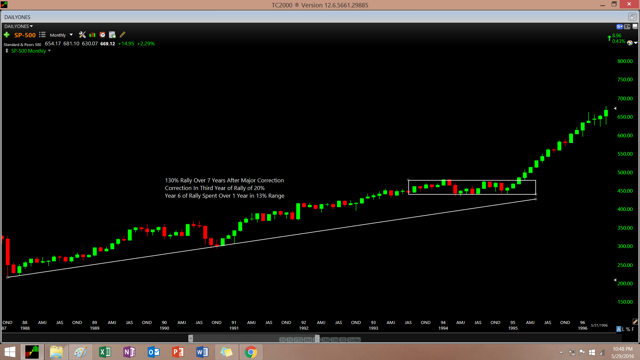
Could 2016 be the new 1995?
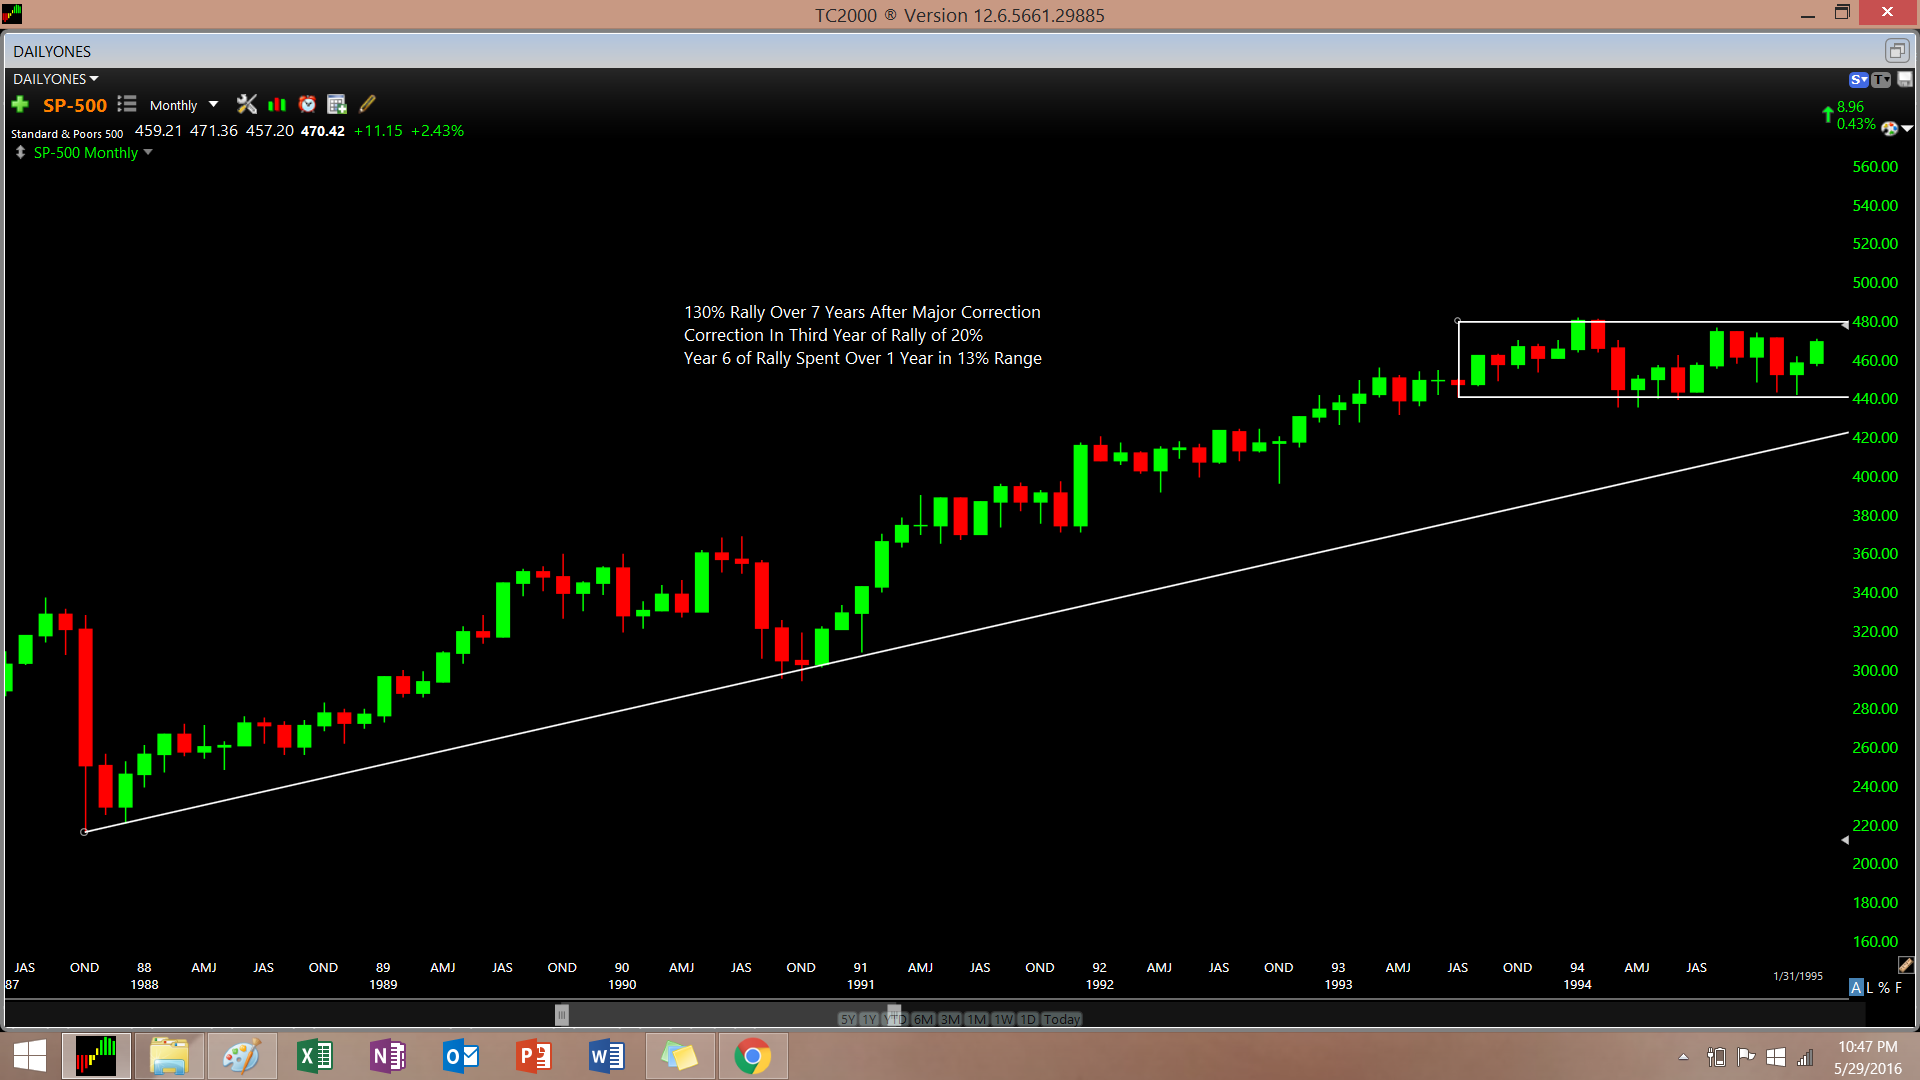
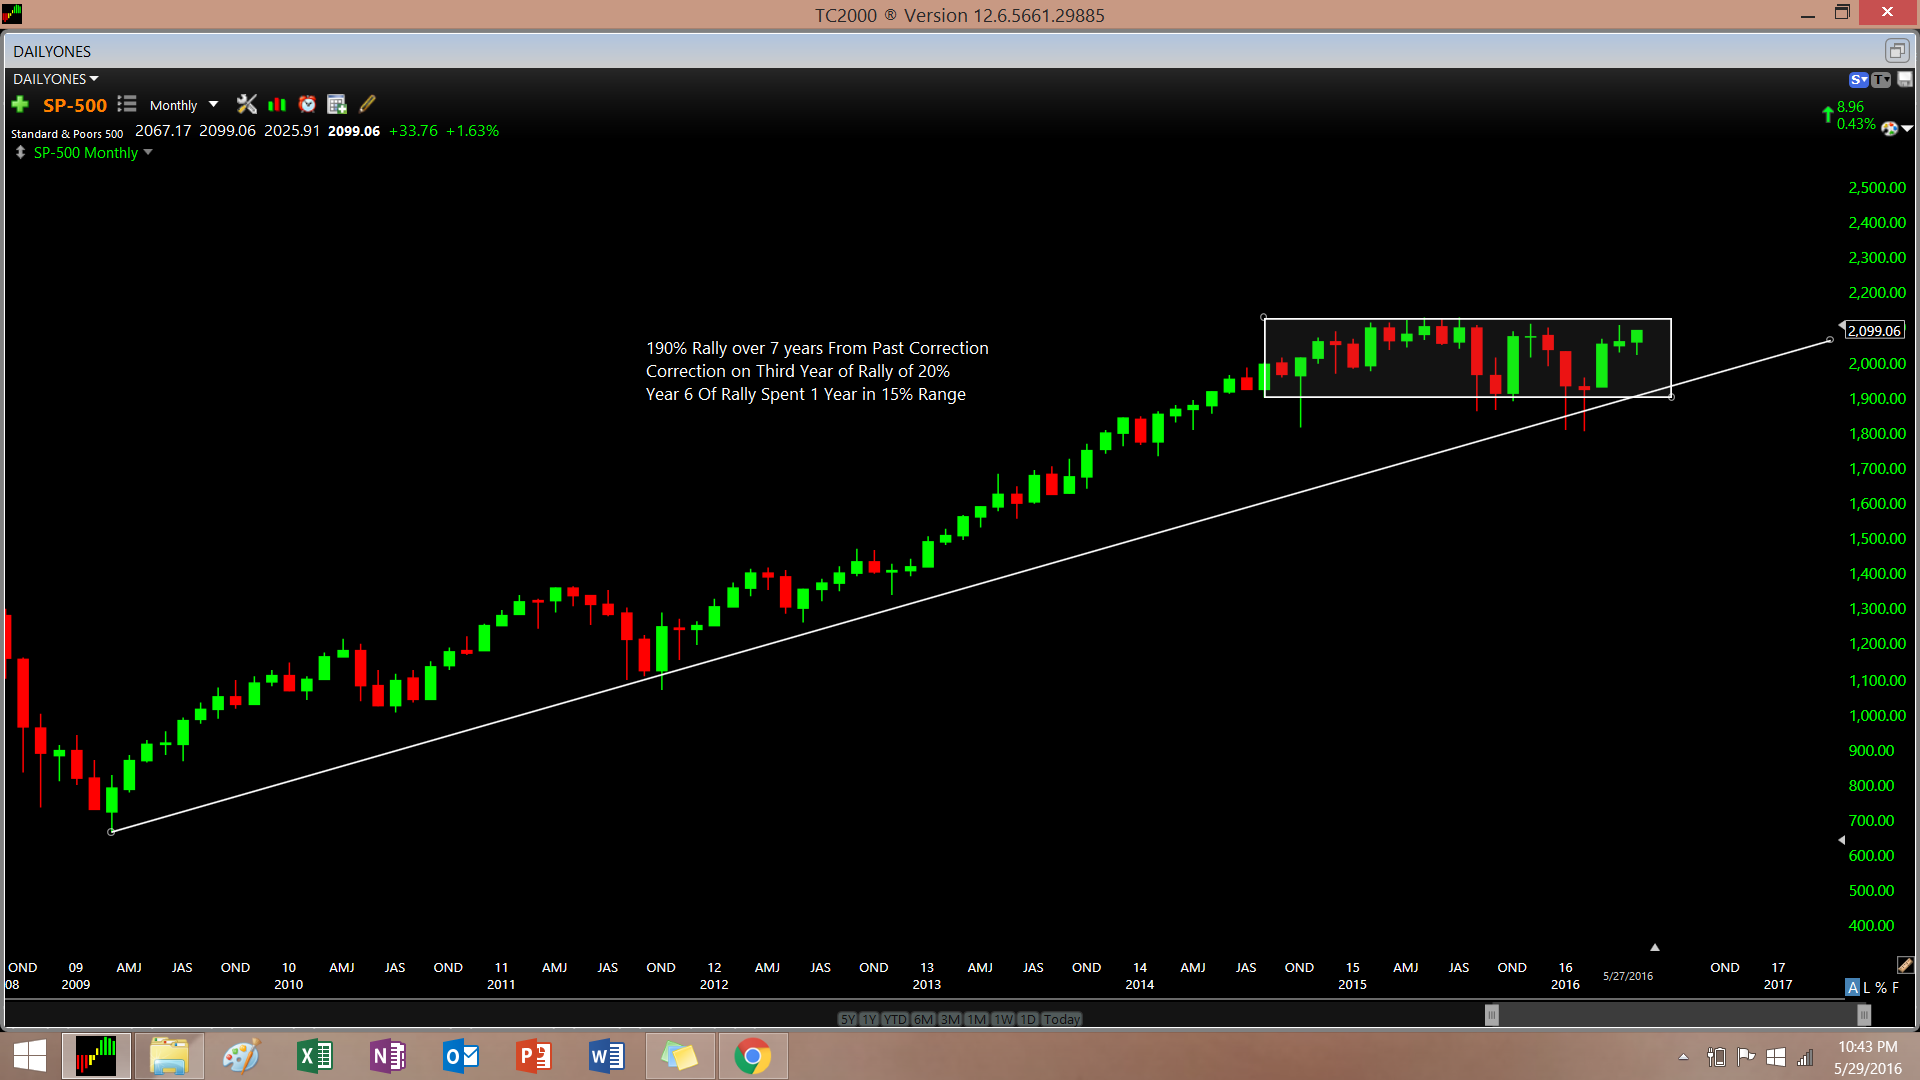
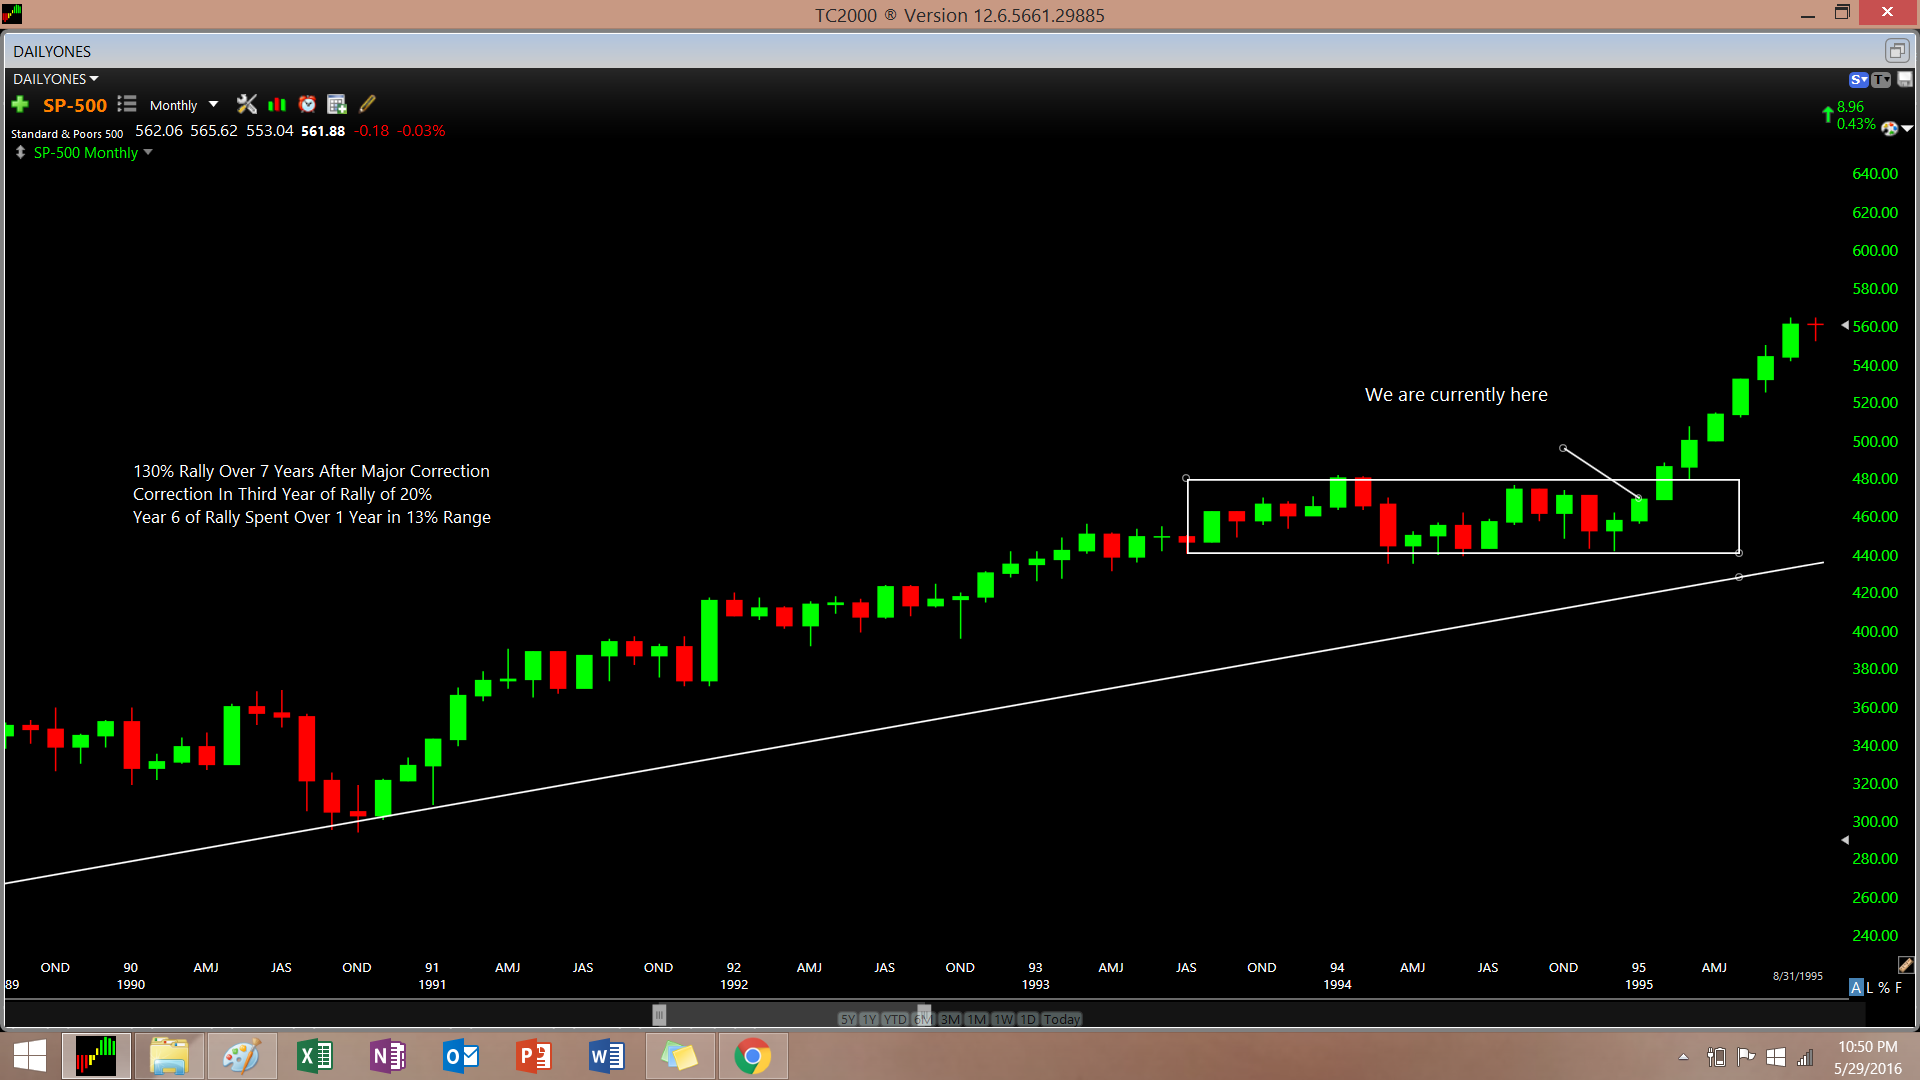
The past year the market has traded in an extremely tight range without making a new all-time high. While many bears cite this as being very bearish and believe we are rolling over, I could not disagree more. There is nothing bearish about going sideways and the down-trends that existed for the first few months of this year have now become powerful breakouts. I have attempted to find a time when the S&P 500 looked similar to this in the past 60 years and found one example to be eerily similar. The first chart is the S&P 500 between 1987 and 1995. In 1987, the market experienced a 37% decline from its highs before beginning a 7-year rally which gained over 130%. Sound familiar at all? In 2008, the market experienced a 56% decline from its high before beginning a 7-year rally which gained 190%. In 1990 (3 years into the rally) the market fell 20% and had another bear market correction to make it twice in a 5-year period with severe corrections. In 2011 (3 years into the rally), the market fell 20% and suffered a 2nd bear market correction in 5 years. In 1994, after a 6-year rally, the market stalled out and spent 18 months going sideways while it experienced two 10% corrections from the high of the rally. In 2015, the market stalled out and spent 14 months going sideways while it experienced two 12% corrections from the high of the rally. If I sound like a broken record repeating myself right now, then you've got the point. The 2009-2016 SPY is following the 1988-1995 SPY almost tick for tick. While the comparison is not perfectly apples to apples, as this rally was 40% larger in size, I believe this can be attributed to the size of the decline that preceded the rally. While the S&P 500 lost 36% of its value in 1987, the S&P 500 lost 56% of its value in 2009. With a 50% larger decline in 2009, it doesn't seem so illogical that the rally back would be 40% larger in size. I expect to have many skeptics tell me that any two chart patterns can be similar and the economy is completely different and I do agree with that, having said that there are some other similarities. Before I get into the other similarities what I find most interesting is that while a 30% rally this year based on similar sentiment levels seems absolutely ridiculous to imagine, these projections would be almost perfectly in line with the 29% return in 1995 for the S&P 500. The major difference in these two charts is that we have not broken out of this 16-month consolidation yet. If the S&P 500 takes out all-time highs and closes above 2140, there's a very good chance the bulls will break loose and take this market much higher. 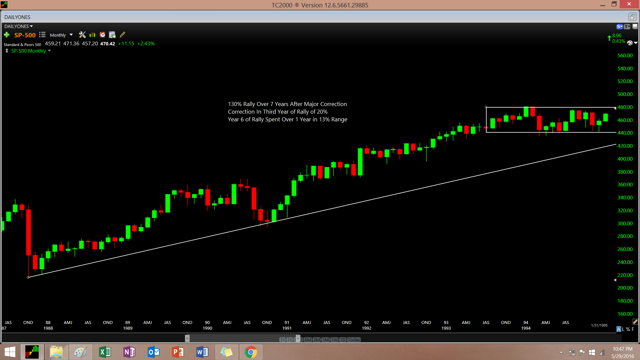
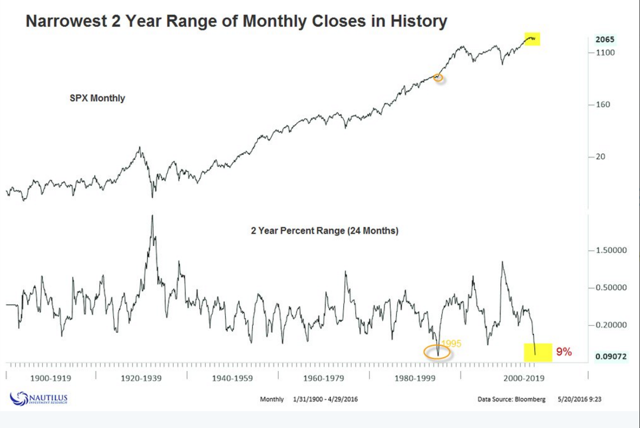
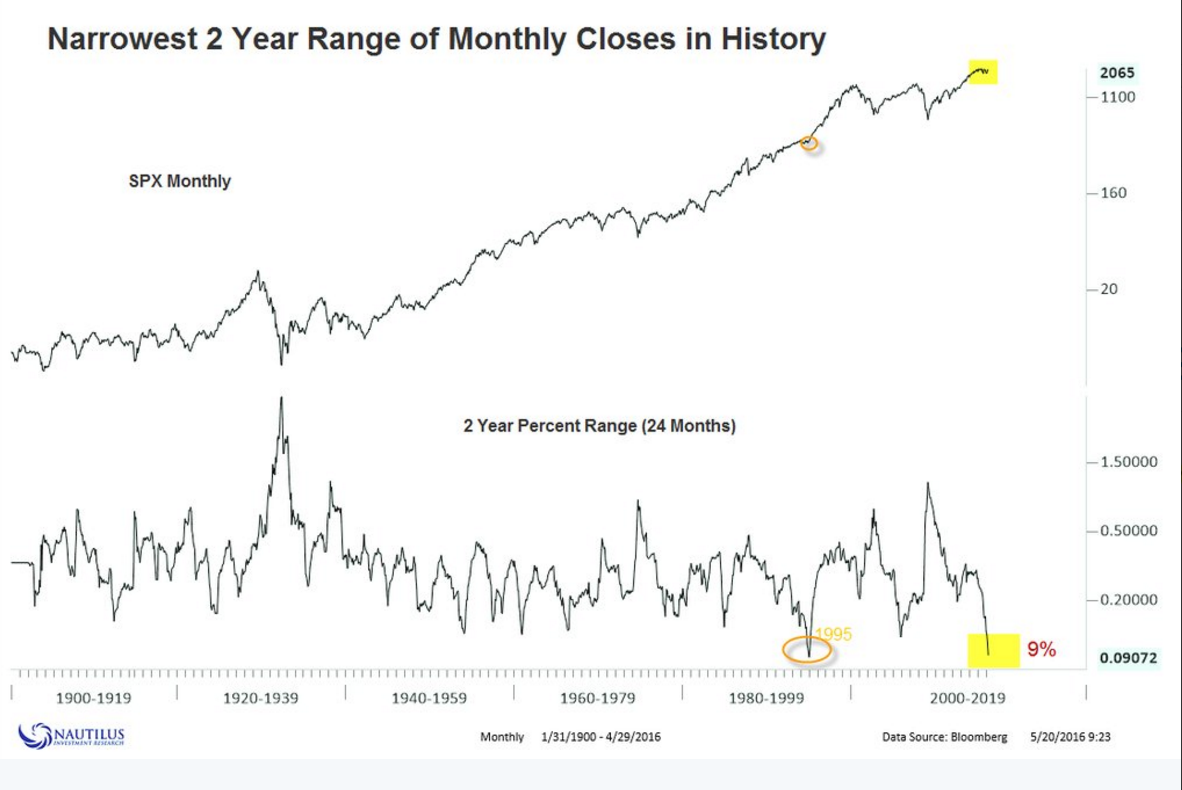
The above chart shows that we are currently in the narrowest 2-year range of the past 120 years. What I find eery about this statistic is the only time we shared a range similar to the current one, was also in 1995. The market exploded from 450 to 750 in 2 years and gained over 70% without recording any correction of 15% along the way.
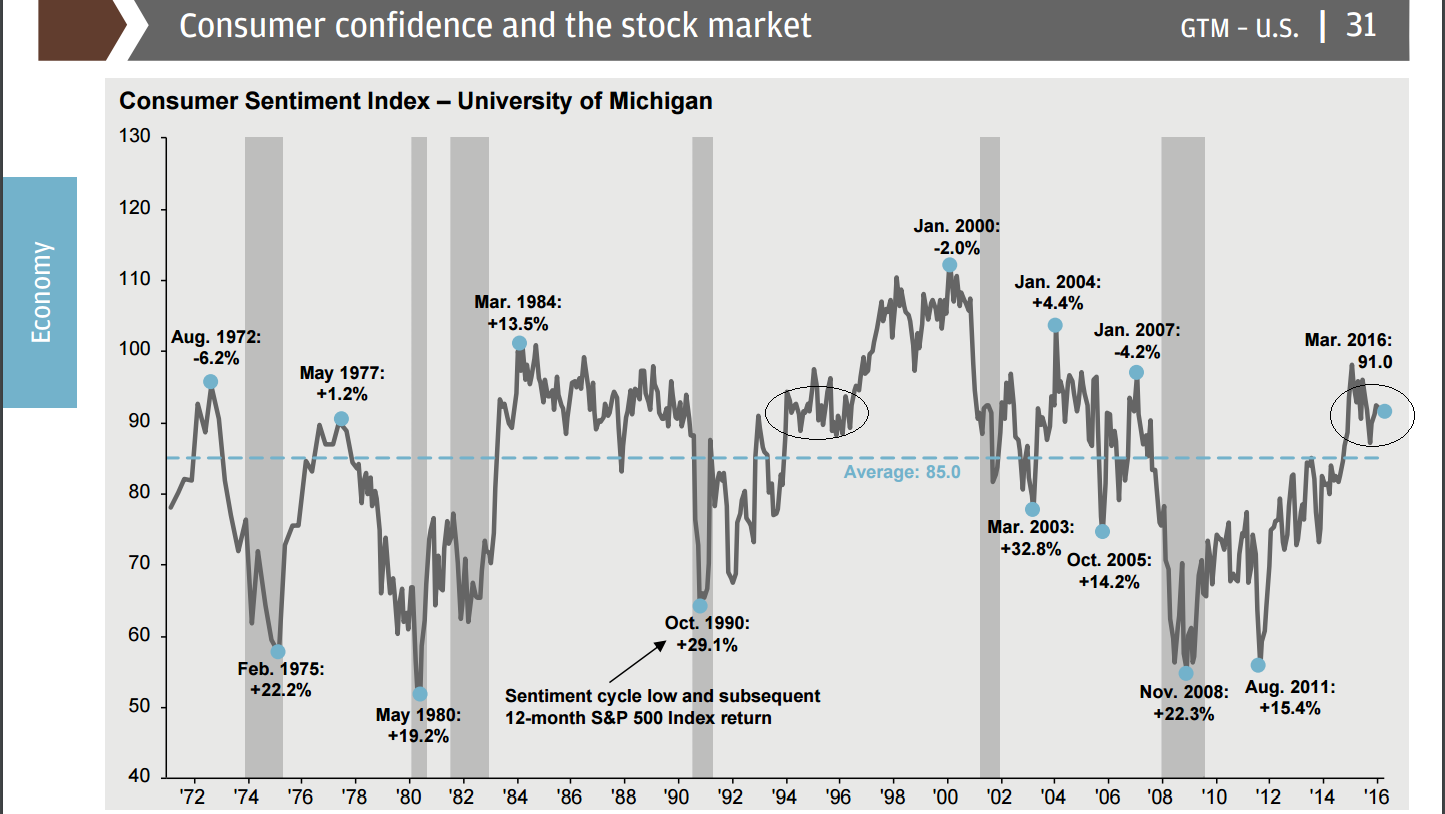
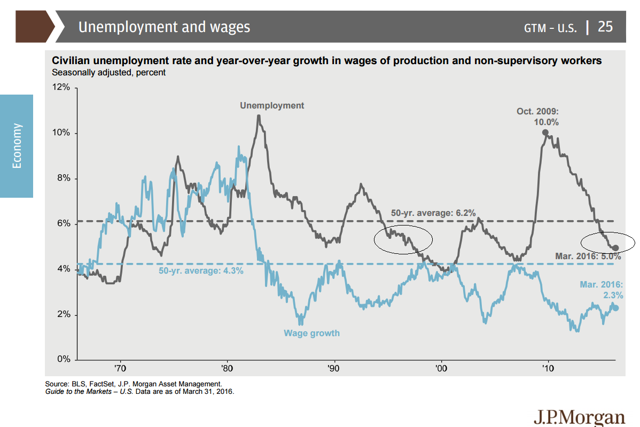
On the economic front, unemployment was at almost the exact same levels in 1995 hovering just above 5% shown on the below chart. In terms of consumer confidence, we were also at the exact same levels in 1995, with a reading of 91 for each based on the Consumer Sentiment Index. While I don't believe we are going to follow this analog perfectly, there is no denying these statistics are very similar and worth keeping an eye out for if we do breakout to new all-time highs.

Election years are bullish
With the election slated for November this year, I thought it would be worthwhile to see how the market performs in the past on election years. Over the past 110 years, the average gain for an election year has been 8.27% with 73% of the years showing positive year-to-date returns. Taking a deeper look at election years, the below chart shows the seasonal data for which months perform the best during all election years. March is typically the 2nd strongest month and this certainly rang true this year so far with a 6.6% gain recorded in the month of March alone. While the 6.6% gain was gaining back lost ground, it still fit with the data showing that we can expect to see a similar seasonal pattern play out. The most interesting point of this seasonal chart is that we are currently heading into the strongest 3 months of the election year following March, which typically average gains of 6.3% over the next 3 months. While this statistic is not perfect, these months are the strongest and record gains over 80% of the time over the past 100 years. With the S&P 500 2% from an all-time high, these seasonal statistics certainly do not hurt given it only needs a little fuel to complete its 2-year break-out to all-time highs. Even if the market only recorded half of the average gain over the next 3 months based on 100 years of data, the S&P 500 would make a new all-time high and be sitting at 2165 by August. 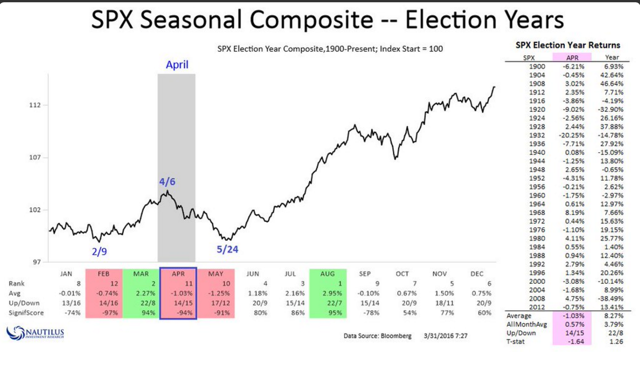
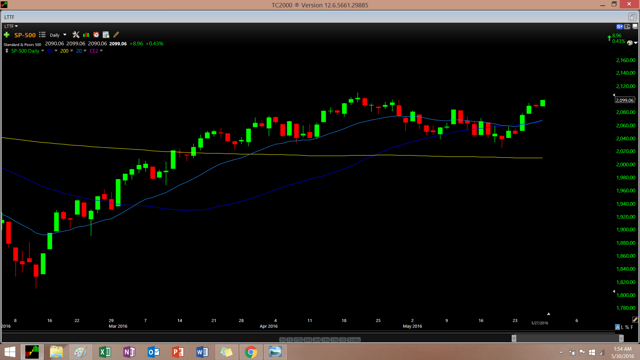
Technical Outlook and Summary
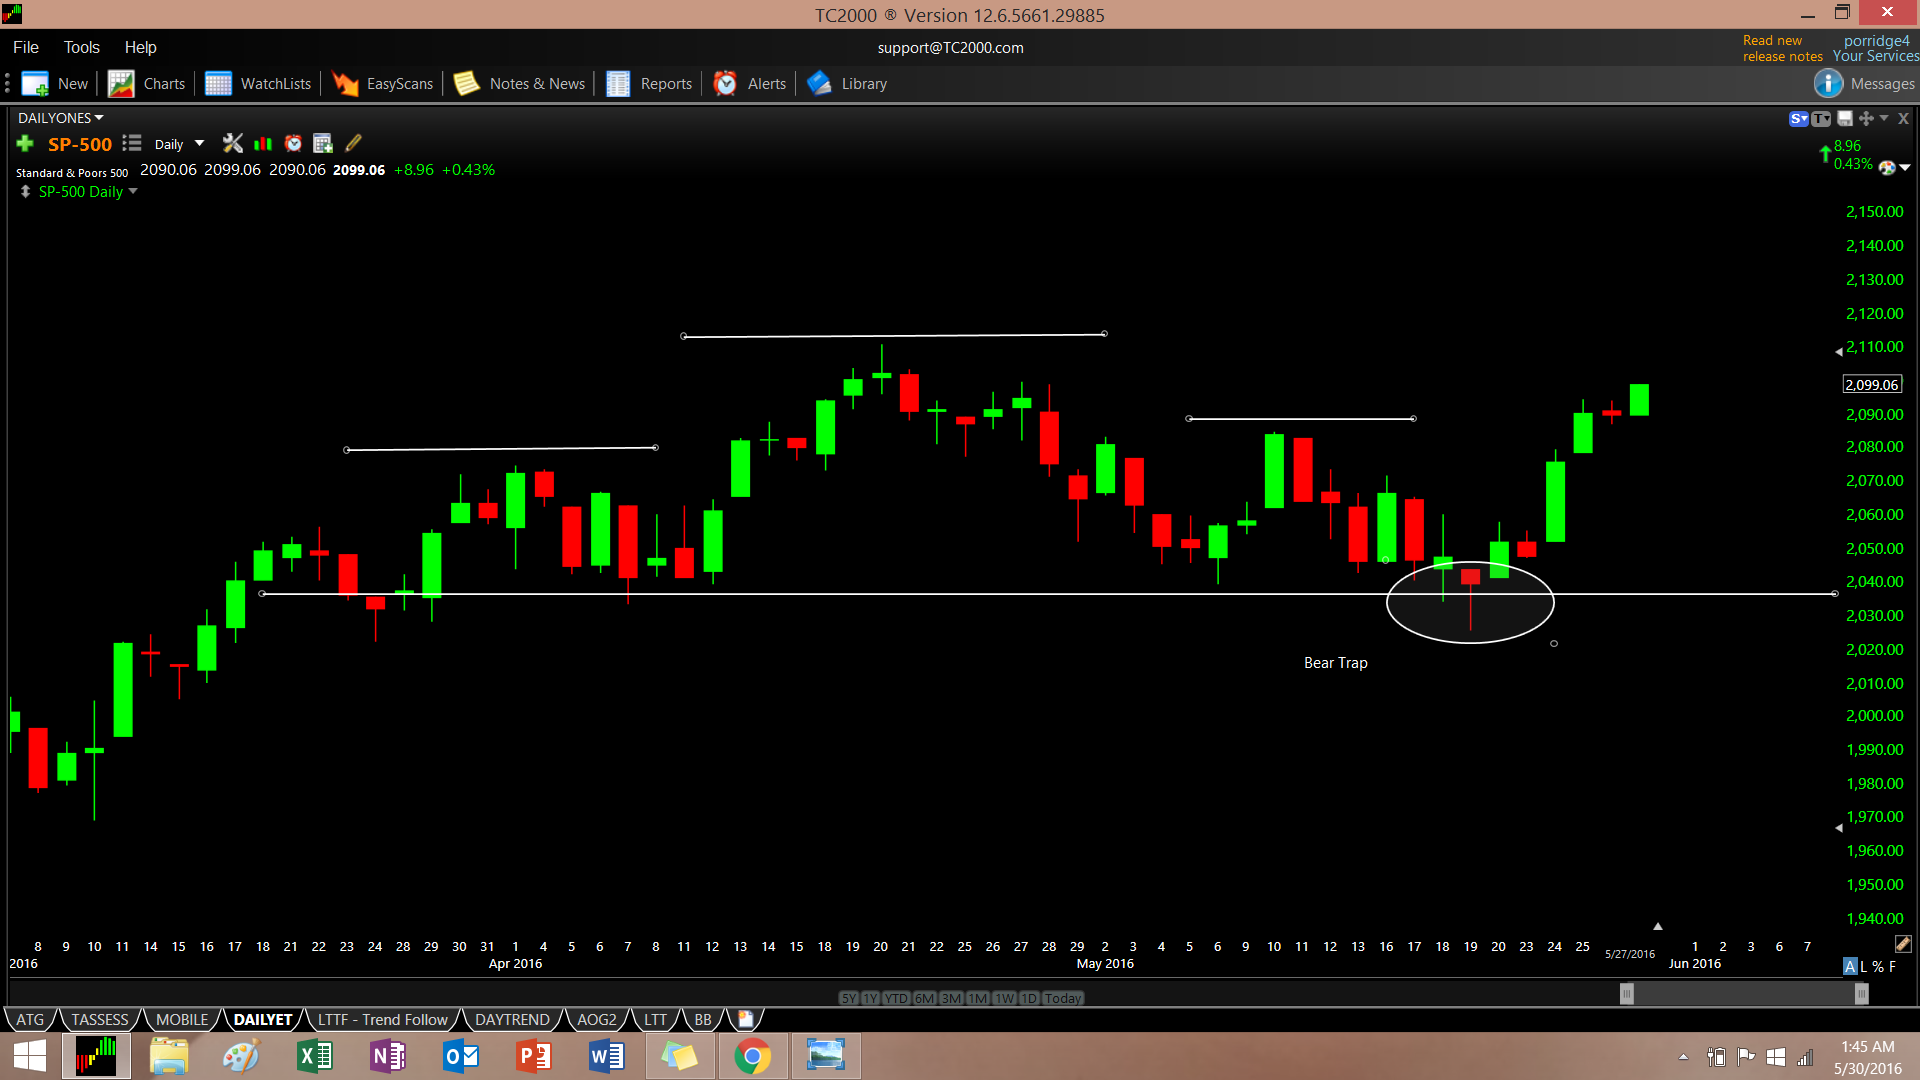
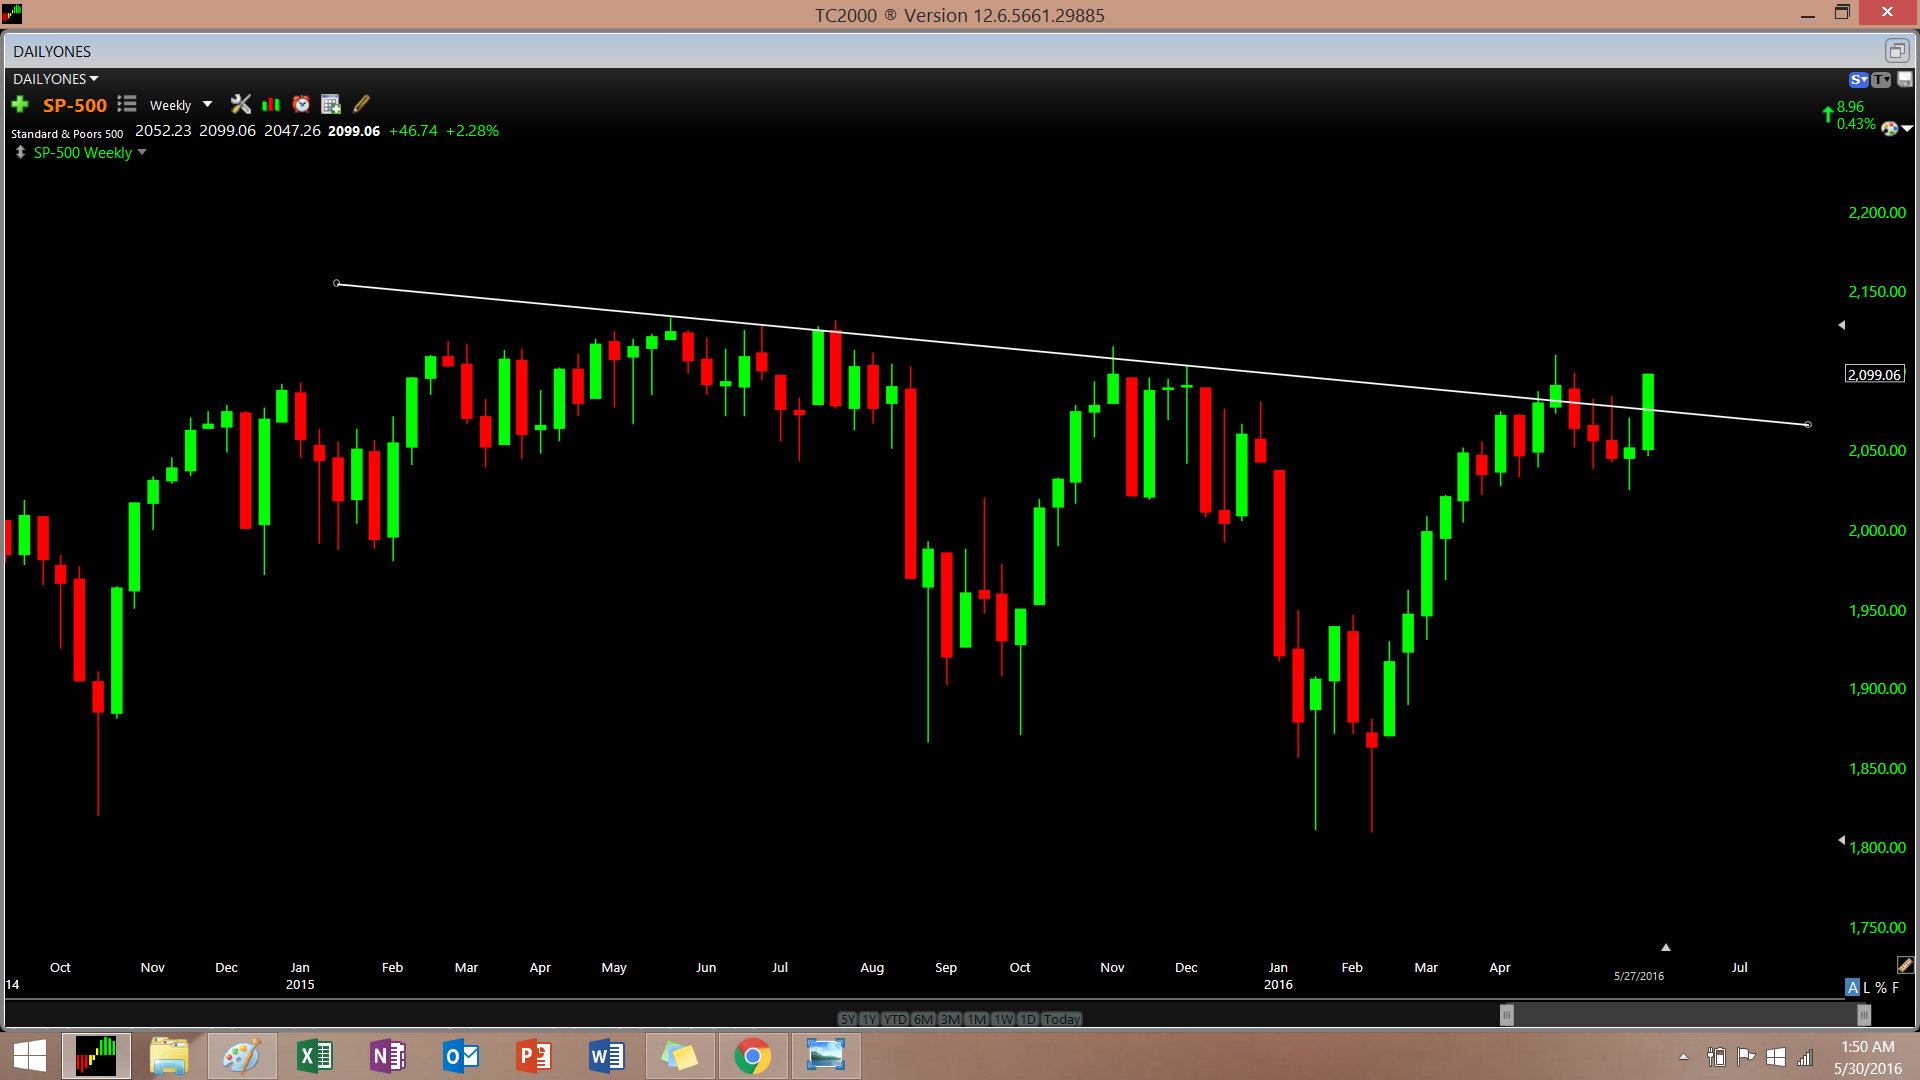
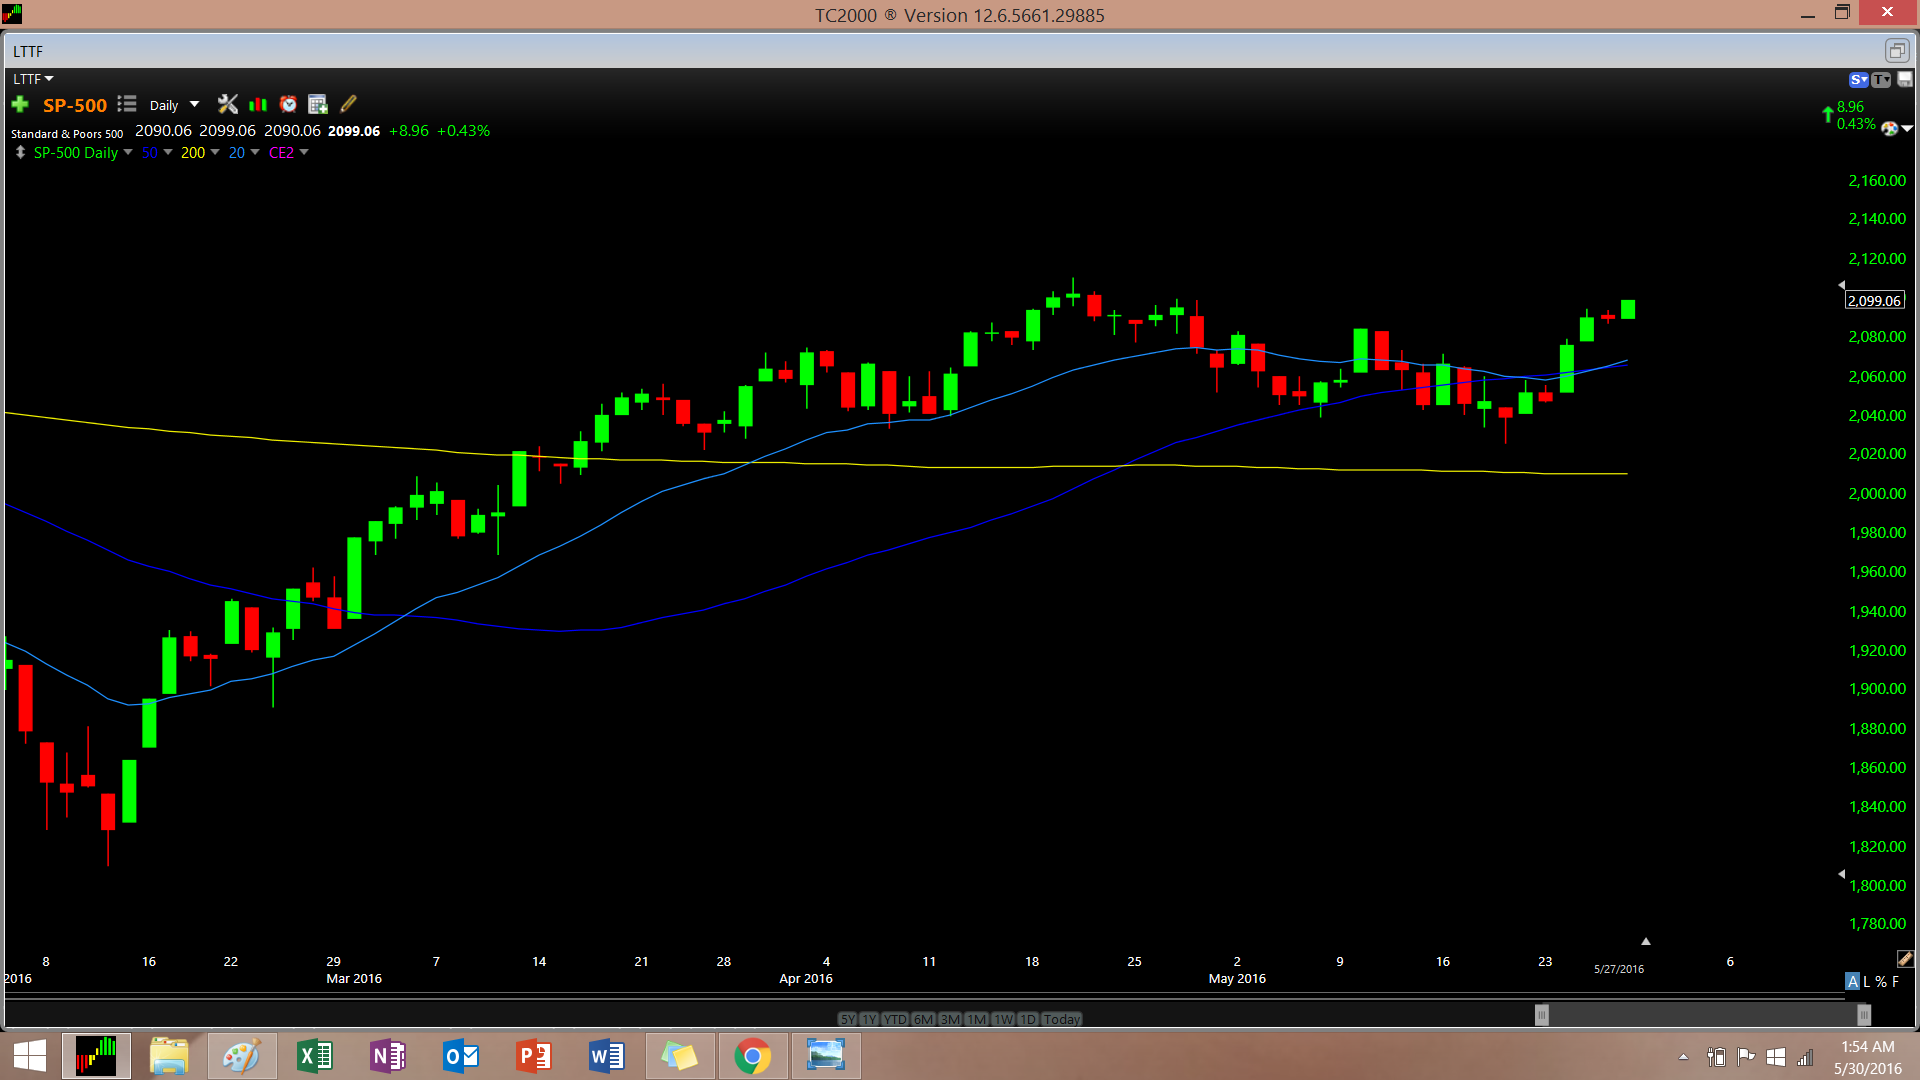
From a trend following perspective, there is absolutely nothing bearish about the S&P 500 nor the other U.S. indexes. The market is above all of its key moving averages and staged a 16% rally while only giving back 4% before snapping right back to its highs. While the bears were busy pointing out the head and shoulders pattern, the market quickly negated this pattern and sprung back to its highs. Any stubborn bears looking to short the neckline break are now down 3% on their shorts and holding short positions less than 2% from all-time highs in one of the most seasonally bullish times during an election year. Where the bears saw a neckline violation and a technical breakdown, the bulls would have seen support and the market spent less than half a day below the 2,030 breakdown before hammering above it. For the bears who continue to state we are in a down-trend, this was an increasingly difficult week as we broke back above the down-trend line and closed with conviction above it. Looking from a trend following perspective, the market continues to climb higher while its 200-day moving average attempts to flatten out. The 200-day moving average is the bull/bear line in the sand as stated by Paul Tudor Jones and since the market regained it, it has been off to the races. The initial break above the 200-day moving average was at 2019 and after spending a month digesting the past 120 points, the market now sits 80 points higher after a brief dip to its 50-day moving average. Currently, the 20-day and 50-day moving averages are pointing up and providing support at 2070 should any micro dips occur in the coming week. While some sidelined investors may have attempted to get back in the market at the 200-day moving average, they did not get their chance as it came within 1% of the 200-day before reversing higher. 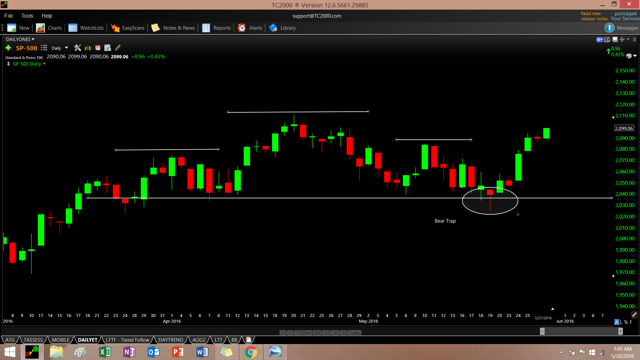

If the S&P 500 does see weakness to start June, I believe it would be prudent to buy the dip as 2060-2070 should be strong support going forward. I personally see the market closing higher for the month as investors and money managers are forced to chase the market as most funds are lagging the benchmark index being on the sidelines.
While none of this is for certain and anything can happen, both technicals and fundamentals are pointing to a very interesting 2016. With all time frames for SPY being bullish, sentiment at levels which correlate with very positive returns and seasonal data also very bullish over the next 3 months, I don't see it as very wise to be short. This has not been an easy market to be long and I can completely understand why many are on the sidelines as they feel they are chasing a market that has just moved 16% off the lows without them. Having said that, I see zero reason whatsoever to be short this market based on the data I have outlined in the above article. If the seasonal election data plays out, we will climb another 6% this year. If the rare sentiment data plays out, we will climb over 25% this year. If the 1995 analog plays out, the bears are going to be wishing they had just hibernated this year and stayed out of the financial markets. I don't know what will happen as I am welcome to any outcome and simply follow the trend, but based on the up-trend we are in and the data above, I am leaning bullish and 100% long currently. If the S&P 500 closes below 2000, I will have to change my thinking and will significantly trim my longs but I believe the pain trade is much higher this year.
Disclosure: I am/we are long SPY.
I wrote this article myself, and it expresses my own opinions. I am not receiving compensation for it (other than from Seeking Alpha). I have no business relationship with any company whose stock is mentioned in this article.
Additional disclosure: If you liked this article and found it useful, please feel free to follow me by clicking on my name next to my avatar at the top of this article. I also invite you to check my performance at TipRanks.com where my average return this year is 60% on new long positions.
seekingalpha.com |
| |
|