Hottest July on record - global surface temperature with year to date
Sou | 7:20 AM

According to GISS NASA, the average global surface temperature anomaly for July was 0.84 °C, which is 0.1 °C higher than the previous hottest July in 2011.
Because July is the hottest month of the year, I've seen it reported as the hottest month ever in recorded history!
The average for the seven months to the end of July is 1.06 °C, which is 0.25 °C higher than any previous January to July period. The previous highest was last year, which with the latest data had an anomaly of 0.81 °C.
There are now ten in a row of "hottest months" from October 2015 to July 2016 (that is, hottest October, hottest November etc). If we could look back over the entire Holocene, it's probably more than 7,000 years since there was a similar run of hottest months on record, that is, not since the Holocene climatic optimum (it's probably hotter now than it was back then).
Here is a chart of the average of 12 months to July each year. The 12 months to July 2016 averaged 1.02 °C above the 1951-1980 mean and was 0.21 °C hotter than the 12 months to July 2015:
Figure 1 | Global mean surface temperature anomaly for the 12 months to July each year. The base period is 1951-1980. Data source: GISS NASA
Below is a chart of the month of July only. Hover over the chart to see the anomaly in any July:
Figure 2 | Global mean surface temperature anomaly for the the month of July only. The base period is 1951-1980.Data source: GISS NASA
Will there be a La Niña?
You can see the global mean temperature trend by month in the chart below, for the strongest El Niño years since 1950, which were followed by a La Nina. I've included the 2015/16 period for comparison. The chance there will be a La Nina is getting lower with each ENSO update. If it happens, it is expected to be quite weak.
Not counting 2015/16, of the seven very strong, strong and strong to moderate El Ninos since 1950, there were only three that were followed by a La Nina. The chart spans a three year period. That is, for the 2015-16 El Niño and subsequent, it goes from January 2015 to December 2017. (For a more detailed explanation see the HW articles: El Niño to La Niña years with more detail here.)
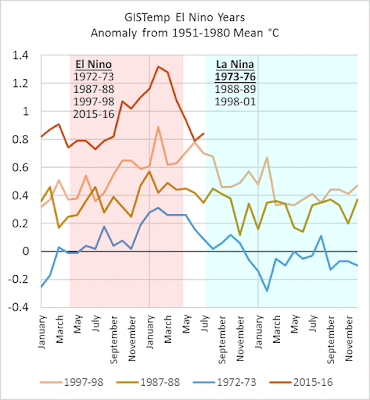 | | Figure 3 | Global mean surface temperature for strong or moderate/strong El Nino years that were followed by a La Nina. Data source: GISS NASA |
Where was it hot?
Again, the high latitudes in the northern hemisphere had areas with high anomalies this month but, as with May, they were not as high as last month. There are also some parts of Antarctica that were very, very hot for that part of the world, and some areas that were very very cold.
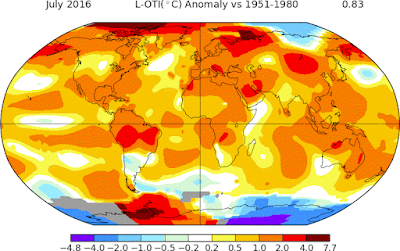 | | Figure 4 | Map showing mean surface temperature, anomalies for July, from the 1951-1980 mean. Source: GISS NASA |
Below is June for comparison:
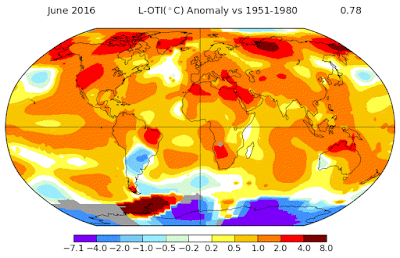 | | Figure 5 | Map showing mean surface temperature, anomalies for June, from the 1951-1980 mean. Source: GISS NASA |
Year to date average surface temperature
The chart below tracks the year to date. Each point on the plot is the average of the year to that month. For 2016, the last point is the average of all months to date including July. This year is tracking well above 2015, partly because of the El Niño. To drop below the average for 2015, the average anomaly for the next five months would need to be around 0.6 °C or less:
 | | Figure 5 | Global mean surface temperature, progressive year to date to July 2016. Data source. GISS NASA |
The next six months would have to be the temperatures of 8 years ago...
Given the speculation that this will be another "hottest year", below is a chart showing the average temperature for the five months from August to December from 2000 onwards. To be cooler than last year, the average of the next five months would need to be about 0.6 C or cooler. Six of the last 16 years were below 0.6 C however the last time the average for those six months was below 0.6 C was eight years ago in 2008.
Figure 6 | Global mean surface temperature anomaly for the five months from August to December. The base period is 1951-1980. Data source: GISS NASA
blog.hotwhopper.com |


