"The pause is shown by satellites"
No pause. BTW. did you know nobody lives where the satellites roam? We're all down here on the surface, coming off of one of the hottest months ever.
When climate Lysenkoists massage and adjust the satellite temperature data, deniers never seem to notice.
Message 30449511
=
Troposphere temperatures for August 2016
Sou | 1:03 PM
to
The troposphere temperatures for August 2016 have been released. The lower troposphere is recorded in UAH v6 beta 5 and RSS TLT v3.3. This report also covers RSS TTT for the troposphere (without the "lower") and follows pretty much the same format as previous monthly updates.
In all records, the August global anomaly was higher than it was in July but lower than earlier this year as El Niño is now over.
For RSS TTT (troposphere), last month was the hottest August on record. For 2016 to be colder than the previous hottest year (1998), the troposphere would have to average less than 0.19 °C for the remaining months.
In the lower troposphere (UAH beta v6.05) last month is the second hottest August on record, lower than it was in 1998. For 1998 to remain the hottest year in the UAH lower troposphere record, the average for the next four months would need to be below 0.32 °C.
Troposphere temperature (RSS TTT v4) chart
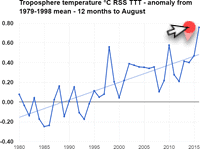
First here is RSS TTT with the latest dataset, version 4. TTT seems to be measure more of the troposphere than TLT (that is, it has a greater vertical profile) with less of the stratosphere than the mid-troposphere data (TMT). It shows a higher rate of warming than RSS v3.3 and higher than UAH. Hover the cursor (arrow) over the plots to see the data points, trend etc.
The chart below is the average of the 12 months to August, from September 1979 to August 1980, through to September 2015 to August 2016.
Figure 1 | Troposphere temperature for 12 months to August (TTT). Anomaly is from the 1979-1998 mean.Data source: RSS
From the RSS website, TTT is derived from TMT and TLS with the formula:
TTT = 1.1*TMT - 0.1*TLS.
This combination reduces the influence of the lower stratosphere, which is cooling at most locations. TLT gives most weight to the temperatures closer to the surface. TTT gives more weight to the troposhere and less to the stratosphere than TMT does, but not as much to the lowest levels of the troposphere as TLT does. However TTT has version 4, while TLT is still only provided as version 3.3. For a fuller explanation see the RSS websiteor the July 16 report here.
Below is the TTT chart just for the month of August. The anomaly for August was 0.73 °C, which is 0.09 °C warmer than August 2010.
Figure 3 | Troposphere temperature for the month of August only (TTT). Anomaly is from the 1979-1998 mean. Data source: RSS
Lower troposphere
The rest of the charts are from UAH beta v6.5. This is almost identical to the old version of RSS, which is v3.3, so is likely to be updated at some time. (Other RSS data sets, like TTT are now at version 4.)
The chart below is the average of the 12 months to August, from September 1979 to August 1980, through to September 2015 to August 2016. The past 12 months is the hottest on record by 0.08 C.
Figure 4 | Lower troposphere temperature for 12 months to August. Anomaly is from the 1981-2010 mean. Data source: UAH
Below is the UAH chart for the month of August only for each year going back to 1979. The anomaly was 0.44 °C above the 1981-2010 mean, which was 0.08 °C lower than the previously hottest August in 1998 (0.52 °C).
Figure 5 | Lower troposphere temperature for the month of August only. Anomaly is from the 1981-2010 mean. Data source: UAH
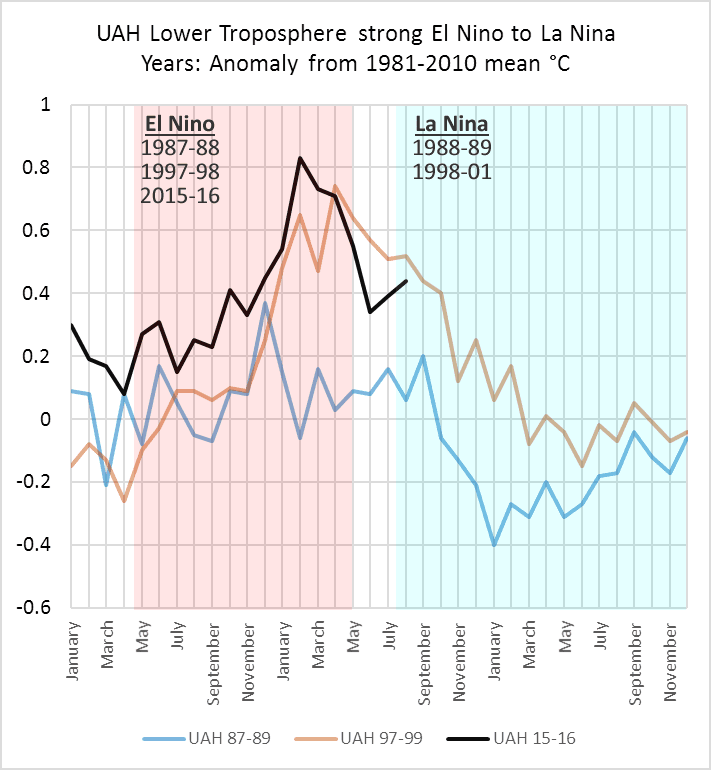
Comparing recent ENSO years
Below is a chart comparing the strongest El Niño years since 1979, which were followed by a La Niña, just for UAH v6beta. I've included the 2015/16 period for comparison.
 | | Figure 6 | Global mean surface temperature for strong or moderate/strong El Nino years that were followed by a La Nina. Data source: UAH |
It looks as if there won't be a La Nina this year according to NOAA, and the above chart supports that.
blog.hotwhopper.com |