Hi H1, a note to another old time poster on SI...... (please pardon my attempt to explain my perspective on the markets)
(they are looking for bigger weakness in stocks than I am currently)
if stocks where to have a big break down... then rates should move lower and bond prices higher...
that would be with an aggressive decline in stocks...... Just about positive that we have migrated into a new secular bear market in bonds....... and so one should be selling strength in bond prices.....
December is a traditionally bullish month so a stock market that does not sell off aggressively and substantially will not provide much of a rally in the price of US bonds.
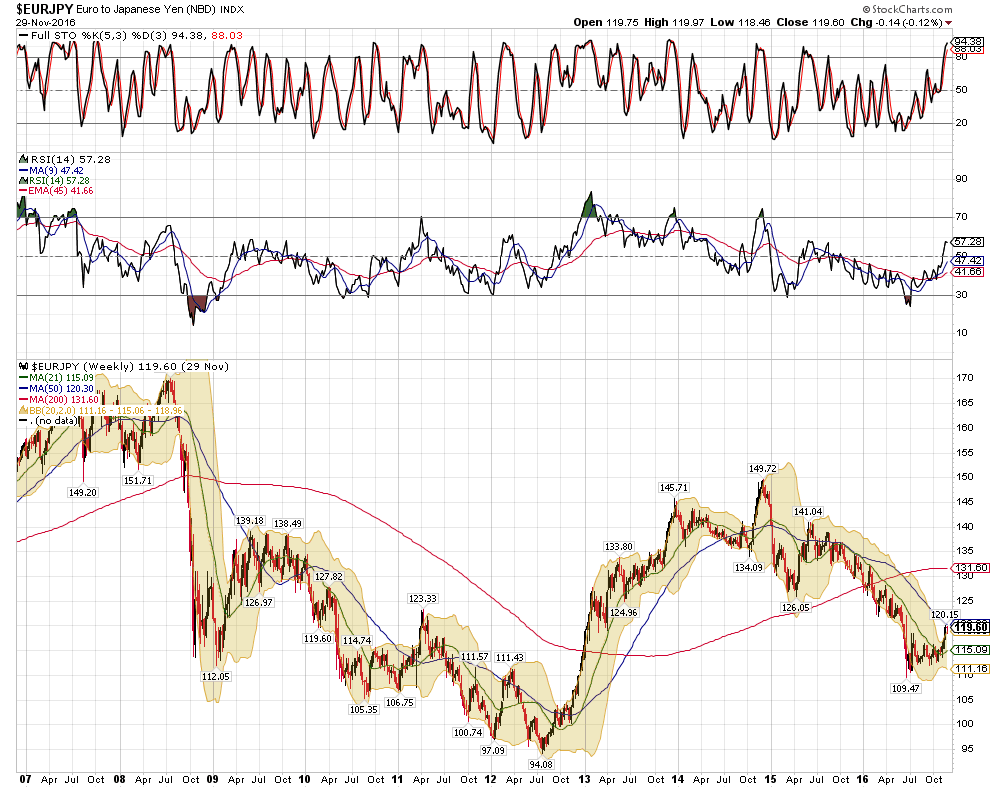
The EUR/JPY --- the long long tested global proxy of risk on vs risk off is indicating a risk on environment..... certainly not the indicating a meaningful break in global equity prices or business conditions over the next 2 months.
Gold and Silver Going down..... inflation expectations are muted.... Crude is working it's way to the $50-55 level that is the Nirvana median level...... that keeps the producing countries solvent and does not restrict global business development due to excessively high energy prices.

---------
the 3 year daily USD chart..... what a bullish looking chart , why would we get anything more than a token stock decline when the USD is obviously going up and it's time for global asset manager to pile into USD denominated assets including our stock market over the first half of 2017.
This chart was developed by my ace Wykoff analyst and it has been appearing periodically for well over 18 months.
been using it since I picked the top in the USD on 3/18/15 the day after I said the USD had made a medium to longer term top at 110.71
| To: The Ox who wrote (16825) | 3/18/2015 2:42:12 AM | | From: John P | 6 Recommendations Read Replies (2) of 18491 | | Hi Ox.
The fact that we don't have any media coverage of the decline in crude makes me think we may see a 39 handle on in by Friday or next week. and then see crude look to retest the 34,00 low of Dec 21 2008
The USD. Had a potential to have an medium term top to longer term top when the $USD registered it a reading of $100.71 yesterday. It is super over extended over it's 200 DMA and 50 WMA.
The Financial Markets are settting us up for a significantly profound period of major instability between now and Sept 28th. 2015.
THIS COMing Friday may prove to increase volatilly and instability by a remarkable amount.
John
Message 29989455 |

--------------------
when everyone was talking about the USD breakdown in May of 2016........ and were getting very bearish....
It did not make sense
| To: humble1 who wrote (23262) | 5/11/2016 2:13:28 AM | | From: John P | Read Replies (1) of 24855 | | HI: ever since Last friday's strong close this advance is looking like it can really take off and give us the best advance in US and possibly global equities this year.. that is not coming out of a big sell off. The SPX and the other big US indices feel like they can really run from here.
CLM will get overtakend by CLN (July crude, will overtake open interest june by close of biz tomorrow.... only a .60 cent pickup with the move to July. I don' t think the US indicies need for crude to do much at all to rally they can rally strongly just on their own merits.. and Gold, silver have pulled back and thus gold as currency is now calming down for this month. Crude might spend more time around $45 and possibly move back up to that $47.50-- $48.00 heading into your June cycle work... I don' think it matters what crude does as it's not going to move much off this $45 level over the next month.
And USD index is doing fine no cause for consternation. The Buck is ok and the BOJ has now stated that they will keep the Yen in line and cap it's price appreciation which has been throwing a spanner in the works for a nice smooth broadbased US stock advance.
Right now I believe we should be looking at the USD index false breakdown below 92.52 last week was a false break down out of an essentially rectangular consolidate formation.

The USD is looking good as our US Equities..... great action in the SPX since last Friday and Tuesday's action really got all systems in a bull mode.
John |
----------------------------
and look at the risk on situation of the of the 10 year weekly EUR/JPY... It has not been this far above it's bollinger band it 10 year..... The Yen carry trade has accumulated over 25 years and it really is impossible to understand how the really massive global Re Insurance companies adjust their global asset allocation models unless we understand that they are doing it over long time frames like tectonic plate shifts... They are crunching interest rate differentials and looking at Global Tranfer pricing movements of huge amounts of money that is just not know to even most really saavy professional hedge fund managers....
-----------
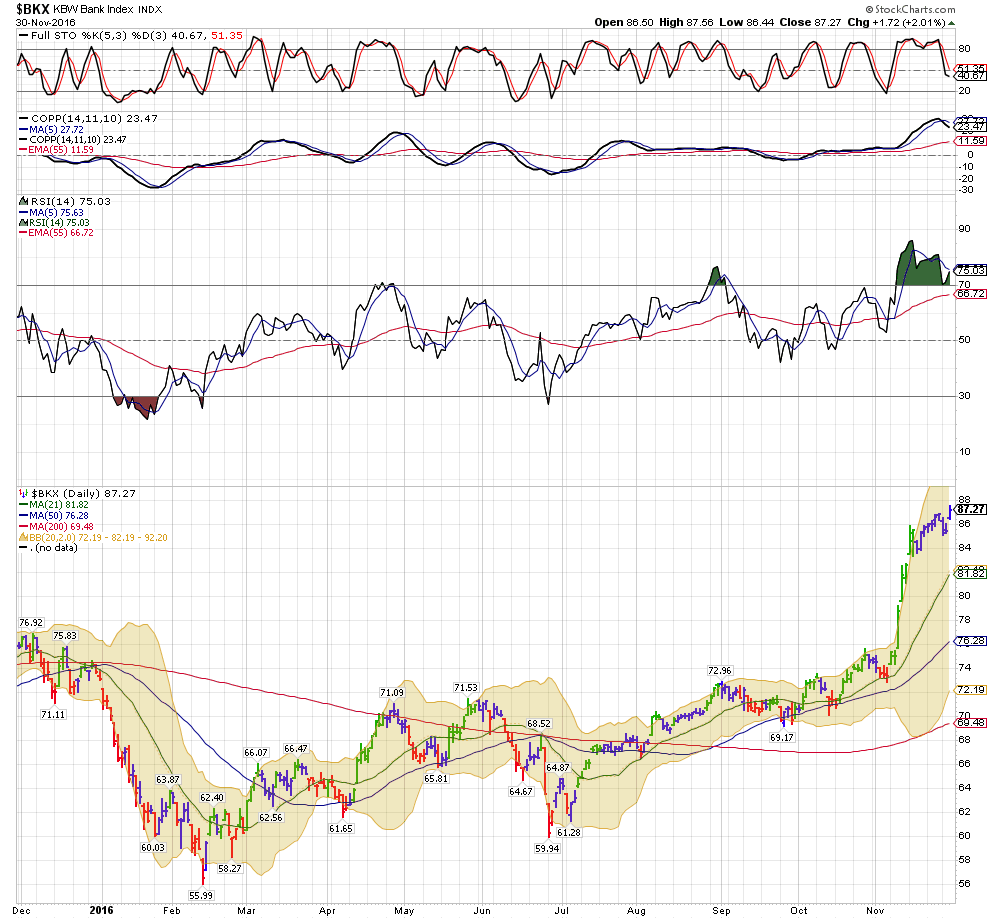
the BKS index......... making a new high
----------
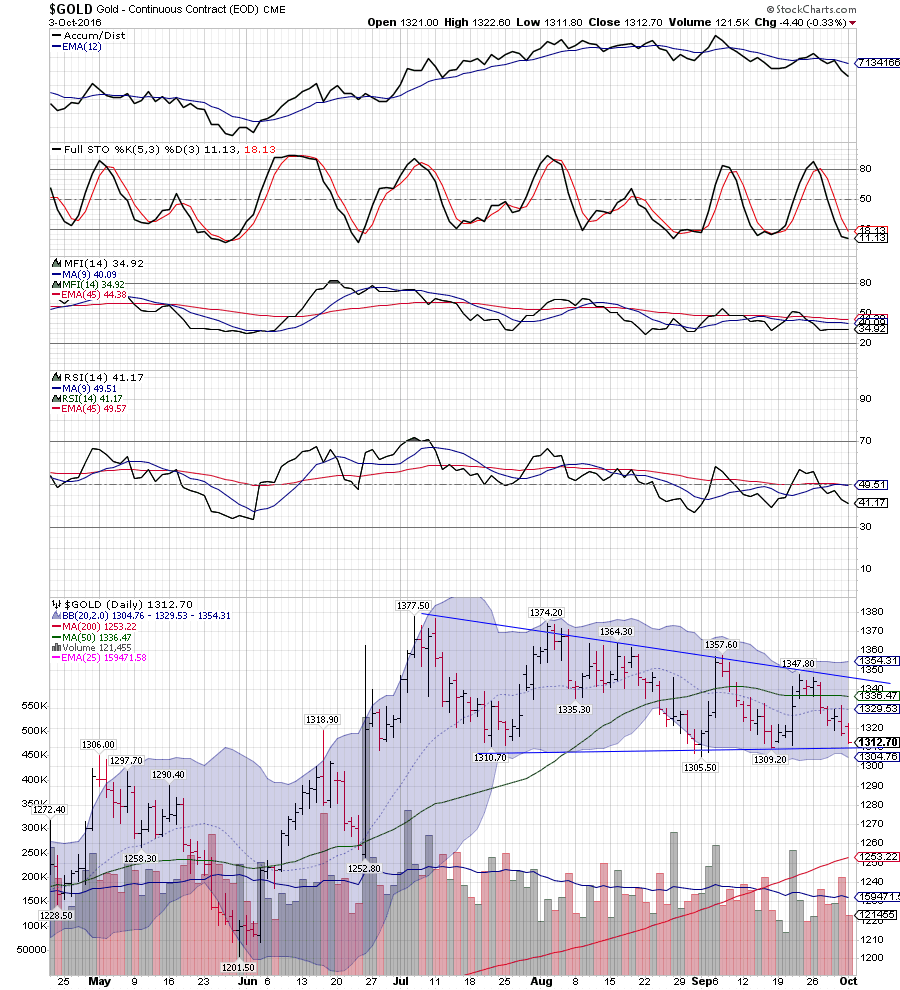
This was my bearish Gold descending chart from Oct 3rd............ Gold and silver have been a wipe out.
--------------
Message 30772914
| To: humble1 who wrote (24462) | 10/4/2016 7:06:07 AM | | From: John P | of 24855 | | H!: The Swiss USD/CHF has also been exceptionally weak, as has the Yen.... The USD index is breaking out to the upside.
Gold is in a very bearish vulnerable formation and looks ready to break down.

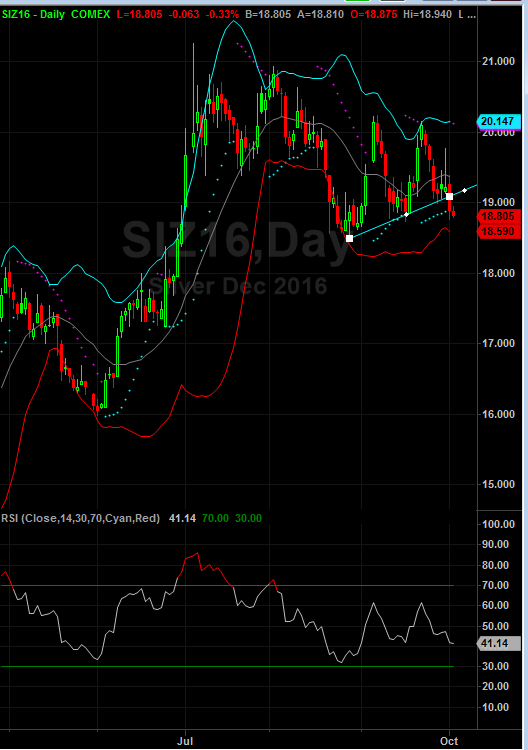
silver is also trading bearishly
There is lots of skittishness occurring globally. One way of looking at this is that you see potential global asset flight into US equities and some of the other global equity markets.
With asset classes being so correlated this weakness may be a big fat red warning flag......
Charles Biderman had some interesting points at the the end of last week. The US investor has been pulling funds out of mutual funds and has not been placing them in ETF's.... a net drawdown in investment in the markets.
Biderman's Approach:
The key premise of our approach is that stock prices are a function of liquidity—the amount of shares available to buy and the amount of money available to buy them—rather than fundamental value. Like the prices of any tradable good, the prices of stocks are driven by supply and demand.
A trading observation that just about always worked for me in the second half of the 1990's ... The US stock market sells off when there is major tropical low in the Caribbean and coming up the US coast.
I wondered if the very low barometric pressure readings gave people a desire to sell... Now I don't know how this works on computer trading.... I would expect a market sell off this week if my old maxim continues to work.
JP |
| |
-------------
flight to safety getting hammered..... Copper... used in an expanding economy.... just turned into a moonshot on 11/7/16
| To: John P who wrote (18465) | 11/7/2016 4:21:23 PM | | From: John P | 3 Recommendations Read Replies (1) of 18491 | | Global conditions improving.... the highly impressive rally in Copper has really surprised me and is reiterating the theme that The FED and the CB's are keen to let inflation run hotter and higher than the 2% target range.
The Dec Futures have had a huge rally today this comes after Copper prices rallied for the 10th consecutive day, their longest winning streak in at least 28 years, as traders bet that the global economy may be picking up after a long period of sluggish growth.
Many investors view copper as a bellwether for economic activity since the metal is a key component in a variety of goods, from refrigerators to smartphones. Other base metals, such as aluminum, nickel and zinc, also have mounted big rallies in recent days.
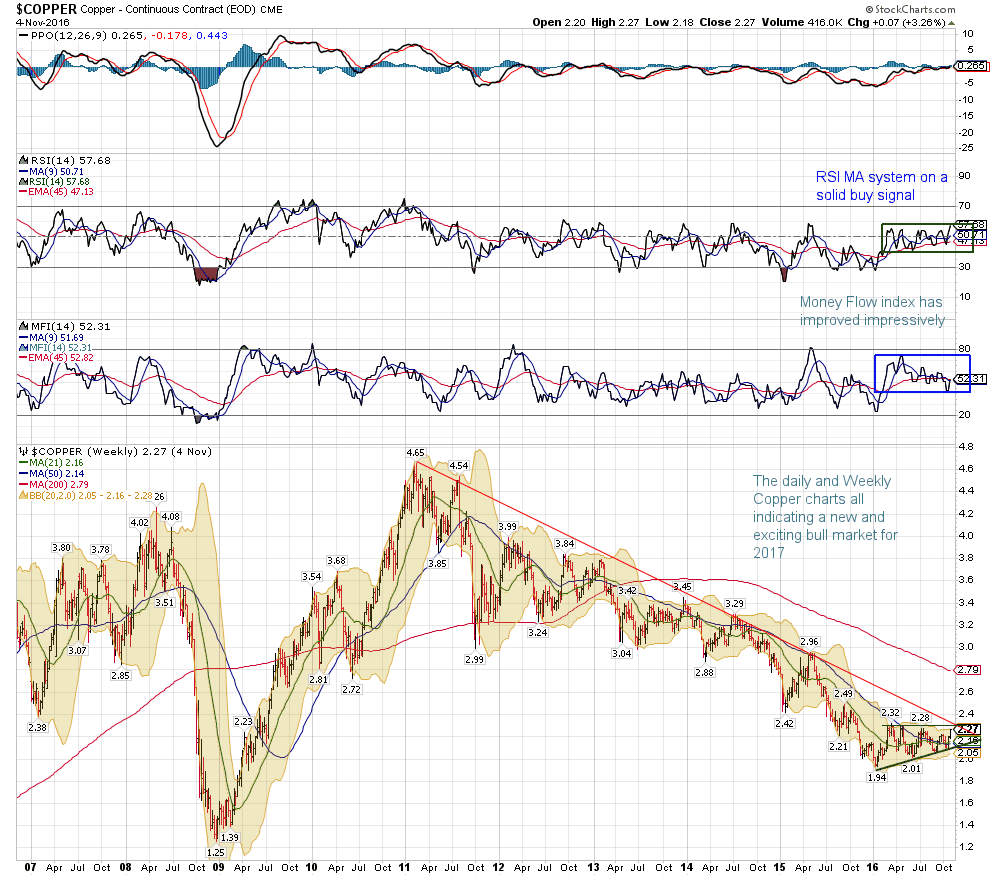
Look at this very bullish ascending triangle that we will be breaking out of.

The current 10-day winning streak is the longest for the front-month copper contract in available data going back to 1988. This surpasses a nine-day stretch that ended on Dec. 21, 2004.
Recent signs that manufacturing and inflation in China and the U.S., the world’s two largest economies, may have turned a corner have helped drive up copper prices.
China’s industrial sector picked up last month, with an official gauge of factory activity rising to its highest level in two years, data showed Tuesday. In the U.S., a gauge of factory activity rose in October, a sign that manufacturing could be stabilizing after two years of challenging conditions.
Tai Wong, head of base- and precious-metals trading at BMO Capital Markets, said copper stockpiles tracked by the London Metal Exchange have declined 10% since Oct. 25. Falling inventories are generally considered a positive sign for demand, as copper is moved out of warehouses for consumption.
The 10 year weekly copper chart is showing that the RSI MA system is on a solid buy signal, as is the Money Flow index, the copper market has created a bottom with a very bullish ascending triangle that we are in the process of breaking out of and this coincides with the downtrend line which would also be taken out given this Bullish situation.
China's economy which has been very appears that it will continue be able to expand as witnessed by the 29% increase in car sales in Oct.
Besides last month’s manufacturing data, Mr. Dragosits pointed to Chinese car sales, which jumped 29% in October for the biggest gain since January 2013, as well as other indicators that show a higher level of financing activity from banks.
China, the world’s second-largest economy, also is its biggest commodity consumer, accounting for some 45% of the demand for copper.
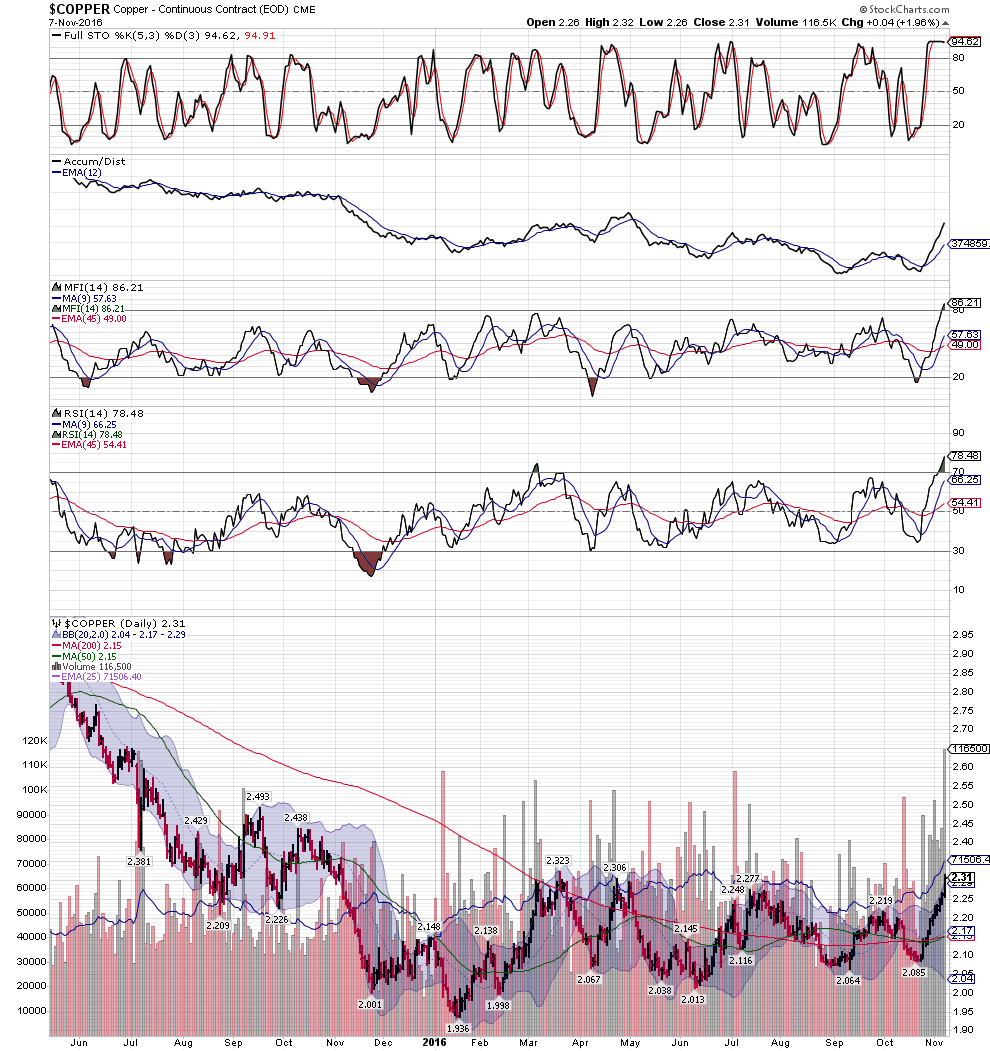
and looking at the 18 month daily chart of copper we see a price rally that is the most dynamic in years, The strongest Momentum on the RSI , highly impressive money flow into the red metal and the accumulation/ distribution reversing into a bullish accumulation situation.

This dovetails with the Bullish stock market rally we were suggesting was unfolding when we commented on early on Sunday evening.
JP |
--------
and for those who may not realize how big the buying in copper has been the below post..... btw.. zinc up to a 9 year high.......
| To: John P who wrote (24666) | 11/30/2016 1:44:25 AM | | From: John P | Read Replies (1) of 24855 | | Copper has been on a big time run... when it had the momentum divergence as it reached 2.75 a couple of days ago... that was my signal to exit longs and largely stand aside.....
when copper explodes the way that it did out of that triangle.... looking at the 150 week MA and 200 week MA provide resistance levels to take profits at.. when moves happen that quickly is when some of the real long term tools such as the 2 I have mentioned can be helpful.
JP

--------------------------
from 11/7 16
Message 30830300
Hi H1, we have some highly bullish action occurring in the Copper market and it should have positive implications for Global growth and a significant US stock market rally..Global conditions improving.... the highly impressive rally in Copper has really surprised me and is reiterating the theme that The FED and the CB's are keen to let inflation run hotter and higher than the 2% target range.
The Dec Futures have had a huge rally today this comes after Copper prices rallied for the 10th consecutive day, their longest winning streak in at least 28 years, as traders bet that the global economy may be picking up after a long period of sluggish growth.
Many investors view copper as a bellwether for economic activity since the metal is a key component in a variety of goods, from refrigerators to smartphones. Other base metals, such as aluminum, nickel and zinc, also have mounted big rallies in recent days.
Look at this very bullish ascending triangle that we will be breaking out of.
The current 10-day winning streak is the longest for the front-month copper contract in available data going back to 1988. This surpasses a nine-day stretch that ended on Dec. 21, 2004.
Recent signs that manufacturing and inflation in China and the U.S., the world’s two largest economies, may have turned a corner have helped drive up copper prices.
China’s industrial sector picked up last month, with an official gauge of factory activity rising to its highest level in two years, data showed Tuesday. In the U.S., a gauge of factory activity rose in October, a sign that manufacturing could be stabilizing after two years of challenging conditions.
Tai Wong, head of base- and precious-metals trading at BMO Capital Markets, said copper stockpiles tracked by the London Metal Exchange have declined 10% since Oct. 25. Falling inventories are generally considered a positive sign for demand, as copper is moved out of warehouses for consumption.
The 10 year weekly copper chart is showing that the RSI MA system is on a solid buy signal, as is the Money Flow index, the copper market has created a bottom with a very bullish ascending triangle that we are in the process of breaking out of and this coincides with the downtrend line which would also be taken out given this Bullish situation.
China's economy which has been very appears that it will continue be able to expand as witnessed by the 29% increase in car sales in Oct.
Besides last month’s manufacturing data, Mr. Dragosits pointed to Chinese car sales, which jumped 29% in October for the biggest gain since January 2013, as well as other indicators that show a higher level of financing activity from banks.
China, the world’s second-largest economy, also is its biggest commodity consumer, accounting for some 45% of the demand for copper.
and looking at the 18 month daily chart of copper we see a price rally that is the most dynamic in years, The strongest Momentum on the RSI , highly impressive money flow into the red metal and the accumulation/ distribution reversing into a bullish accumulation situation.
This dovetails with the Bullish stock market rally we were suggesting was unfolding when we commented on early on Sunday evening.
JP |
| |
I myself and the bankers and traders at 2 of the big global banks would start out trying to figure out what the key driver or two of the markets were..... those potentials broke down into what the currencies were doing, the interest rate market was doing, Whether the bond market ---- whether Australia, UK or US was being driven by moves in Commodities and we would look at equities.
what we basically learned through observation and systems testing is that the Typically either the currency, Global bond, and key commodity makers would set the pace in the action in the other two markets.... and we just had to look at the monitors and see which prices moved first... where the soybeans going up and making the US bonds sell off on inflation expectations. The Currencies drift along on interest rate differentials , until fair value gets out of equilibrium and then we would see a dramatic move in the currency market that would move the other 3 markets.
We found that we ended up backing out what the stock market would do based on which of the other 3 markets was the primary driver of the the time window, which often lasted for several days.
Occasionally, the stock market weather it be the US or larger Global equity markets would set the tempo that then flowed through and moved the other asset markets. That is typically not the case.
When you break it down to specific stock sectors, and value vs. growth vs yield, then those themes play out irrespective of what is going on in currencies, interest rates, and commodities....... with the understanding that when something really dramatic happens in one of those arena's it will push all US and indeed Global equity prices lower of higher.
When I sit down to analysis the Global Macro environment in the morning or after I have been away for a few days.... I don't start off by looking at US stocks as my point of departure for the probabilities for the next few days are.
we tend to gravitate to looking at the key governing asset class and then endeavor to back out how the other markets will respond.... with say US rates going up... inflation hedge metals going down, industrial metals like copper going up..... and what is going on with the currencies.
I am available to attempt to answer questions on this......
John |


