SI
SI
discoversearch

We've detected that you're using an ad content blocking browser plug-in or feature. Ads provide a critical source of revenue to the continued operation of Silicon Investor.  We ask that you disable ad blocking while on Silicon Investor in the best interests of our community.  If you are not using an ad blocker but are still receiving this message, make sure your browser's tracking protection is set to the 'standard' level.
Strategies & Market Trends : John Pitera's Market Laboratory

 Public ReplyPrvt ReplyMark as Last ReadFilePrevious 10Next 10PreviousNext  
To: The Ox who wrote (18520)12/15/2016 1:10:42 AM
From: John Pitera2 Recommendations

Recommended By
3bar
richardred

  Read Replies (1) of 33421
 
Hi OX, I was thinking about you today and our discussions of Nat Gas's very low levels in Nov 2015 and then in early 2016. where we were both bullish and realizing that we were at historically very low levels and that Nat Gas was completely out of favor........ and as I say below the commercials are still long Natural Gas Futures.... Pretty significant since they are selling forward Crude production like crazy for 2 years.

John

Message 30889337

in looking through the latest COT -- Commitment of Traders data... I noticed that the Commercials are actually long Natural Gas even though it has doubled off those 1.60 a Million BTU rates of 13 months ago and then a few months later.

The Last post which has several posts from 2000 was when we were running the GZ fund and GZ and I had been going long the really big NG contracts that existed back then we got Long in Sept as NG was breeaking out to the $3.40 and $3.55 area in the Oct 2000th futures... which would ideally have been rolled into Dec. which is historically the winter seasonal top is made in mid Dec.

It was the Peter Lynch 10 bagger in futures that year......... that and shorting the NDX futures.
----------------------------------------------

To: John P who wrote (17470)12/29/2015 5:10:55 PM
From: John P2 Recommendations Read Replies (2) of 18520
Speaking of Natural Gas... there was a very good reason that I was posting here on the evening of Dec 15th..25 year monthly and weekly Natural Gas charts.... The following day was the day to buy UGAZ the 3X NaturalGas Long ETF which has doubled in price since then and Natural Gas futures bottomed 2 days later and have had a robust 35% plus rally. I have wondered from time to time about some of the lurkers who stop by to read the thread occasionally.

Message 30363965

I got a PM from an SI member who I had never met who has last posted on SI back in 2013 been a member for over a decade.... he wished me a merry Christmas and commented about my gold note of a few weeks ago.

Natural Gas 25 year Monthly and Weekly charts..... the RSI indicators are the lowest they have been over the entire time period which illustrates the depth of the bear market and should make long term contrarians excited over the ability to pick up cheap assets during 2016. The monthly RSI down at 23.70 is very impressive from a historical perspective.


Message 30374917

not sure if this post is on this thread as well.

JOhn

--------------------------------------------

you post from Jan 4th 2016.

To: John P who wrote (17504)1/4/2016 8:58:35 PM
From: The Ox Read Replies (2) of 18520
We were definitely due for a bounce in NG. Your post was timely, JP! Here's the shorter term leveraged chart (borrowed from wolfgangrene's thread)


-----------------------------

To: The Ox who wrote (17519)1/4/2016 11:49:55 PM
From: John P Respond to of 18520
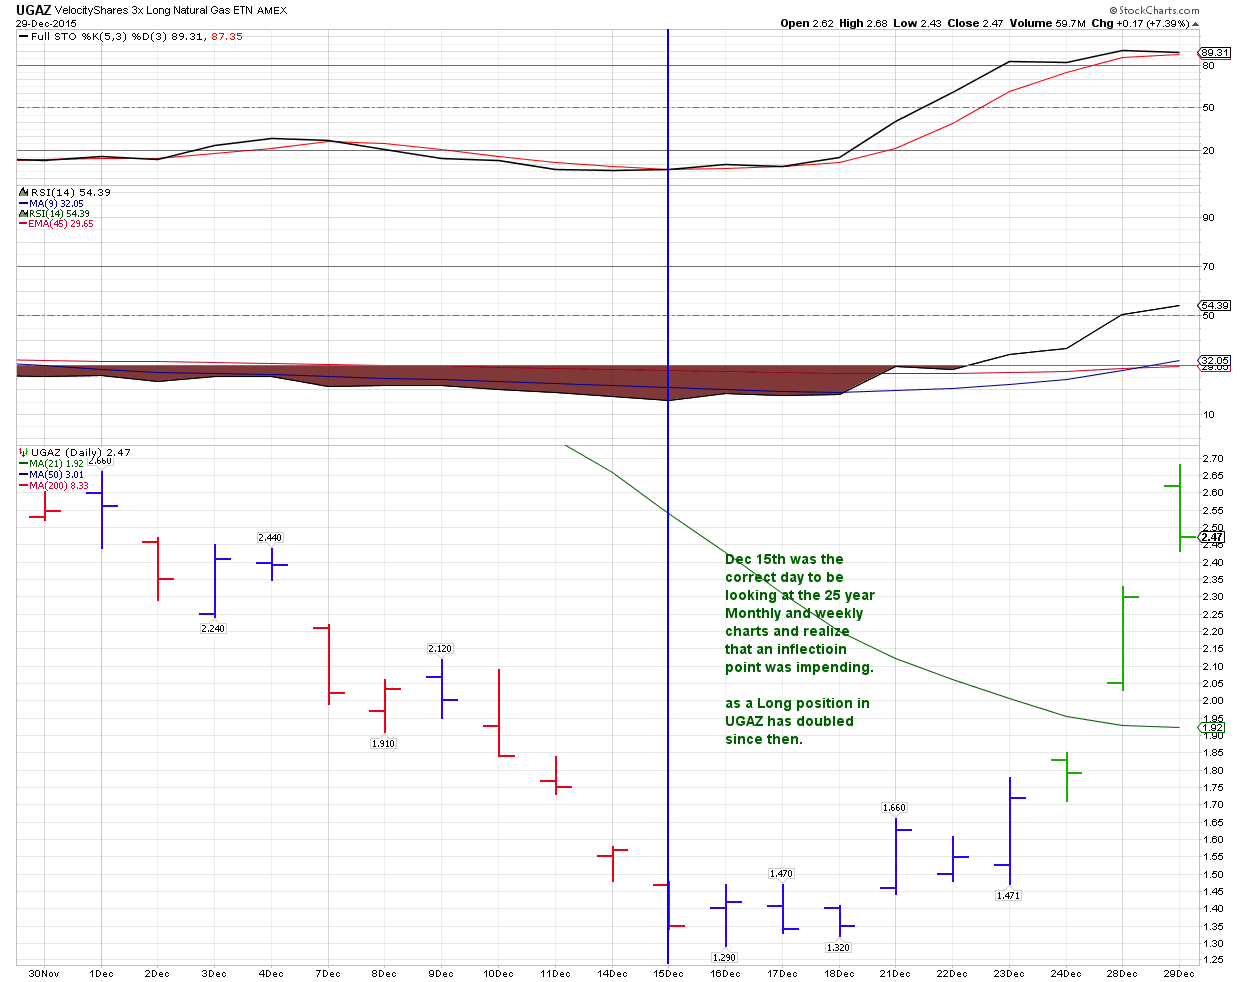
Thanks Ox. The UGAZ daily chart of WG's looks like more upside .....

The below ERX 60 minute energy bull share ETF has a bullish descending wedge that I have not annotated on the chart... The USO and crude are trying to rally.... crude closed above it's 21 DMA last Thursday... and crude may well attempt to work it's way north up to it's 50 Day MA at $40.. that's the bull side

The $40 level is historically tremendously important with the 1980 top occurred there after the run up from the 3 to 4 area was where we when OPEC cartelized itself in the early 1970's... as well as the first Gulf War top at $40 in Jan of 1992

it has to compete with the fundamentals

Light, sweet crude for February delivery fell 28 cents, or 0.8%, to $36.76 a barrel on the New York Mercantile Exchange. Brent, the global benchmark, fell six cents, or 0.2%, to $37.22 a barrel on ICE Futures Europe.

More than 18 months into the crude-price rout, oil production remains high around the world. The U.S. Energy Information Administration on Thursday said that domestic oil production was higher than previously reported in each of the first nine months of 2015.

On Monday, data provider Genscape Inc. told clients that crude-oil stockpiles in the key storage hub of Cushing, Okla., rose to a record in the week ended Friday. Ample Cushing supplies in the past year have sparked some concerns that Cushing, which is the delivery point for Nymex futures, could run out of storage space for oil....

Some oil analysts and investors have argued for months that the low price of crude doesn’t adequately account for a possible supply disruption due to violence or unrest. The oil market has been vulnerable to sharp rebounds in recent months as traders who had bet on lower prices quickly reverse course.

Hedge funds and other money managers have held large numbers of bets in recent weeks that oil prices would fall, according to the Commodity Futures Trading Commission. Increased concerns about geopolitical conflicts could have prompted some traders to close out their bearish bets.


Feb and March of 2017 and Dec of 2018 were the 3 longer dated months on the NYMEX crude strip that had the largest volume today.... and they were all being sold and down on the day.....

The east coast is having it's coldest temperatures of this winter..... as is much of the country that helps Natural Gas in the near term
JP


-------------------

To: The Ox who wrote (17519)1/5/2016 2:54:26 AM
From: John P1 Recommendation Read Replies (1) | Respond to of 18520

OX, we've had some pretty good years with natural gas the fund we had back in 2000 put on multiple contracts when it broke out in the late summer...... back in the the 1990's and in the first several years of this century... the seasonal highs in Natural Gas were definitely in December and thus it gave you a time target to get out .... and also a price high in July for the summer AC season.... the NG market has assumed entirely new qualities since we have had the rise of fracing.

John


Message 14957984

To: John P who wrote (2596)12/6/2000 1:14:49 PM
From: John PRead Replies (2) of 17523
WOW a single Natural Gas Futures contract has gone up $43,000 since the end of Oct. The Jan 2001 NG contract has
traded up to 8.75 today.

It's coming close to winning the title of the Market
of the Year


even my targets have been taken out....

Yes, Natural Gas is going higher. I imagine 5$ is a minimum
and under the right constellation of events,
I think we could see $7 Natural within 4 to 8 months.


Message 14195507

this has been an excellent example of a market that
one tries to buy on a reaction (earlier this year) and
then just stays long with a trailing stop loss.

It also is important to remember that when a market goes
into new alltime high ground, the further upside can be
so much greater than the conventional wisdom.

we might even see $12 in this type of market, but it's
a very dangerous market to trade now if one is not
a commercial.

a couple of old posts talking about the bullish ascending
triangle back below 4.60 in the summer and the contract
specs.

Message 13935506

Message 13935553

One more post I have dug out from this thread, talks
about the Elliot Third of a third concept that Chip was
asking about today, this may further clarify the earlier
post to Chip.

Re. selling the news on oil normally that is that case.
when everyone is talking about a trend it's time for
it to reverse.

occasionally you can find instances were everyone is talking
about something and to use an elliot wave concept, it's
a third of a third wave advance in a bull mkt
or it would be a decline in a bear mkt.

it's a point where their is mass realization of a trend and
it propels the trend much further even though everyone
"knows" about it. The issue is how many people are
long these energy stocks and have been in the energy
complex bull mkt??

the fundamental situation in NG and heating oil, seems
to indicate higher prices, but I agree that it's

"front page" news so we'll have to watch it closely.

John+


Message 14212272


John


Report TOU ViolationShare This Post
 Public ReplyPrvt ReplyMark as Last ReadFilePrevious 10Next 10PreviousNext