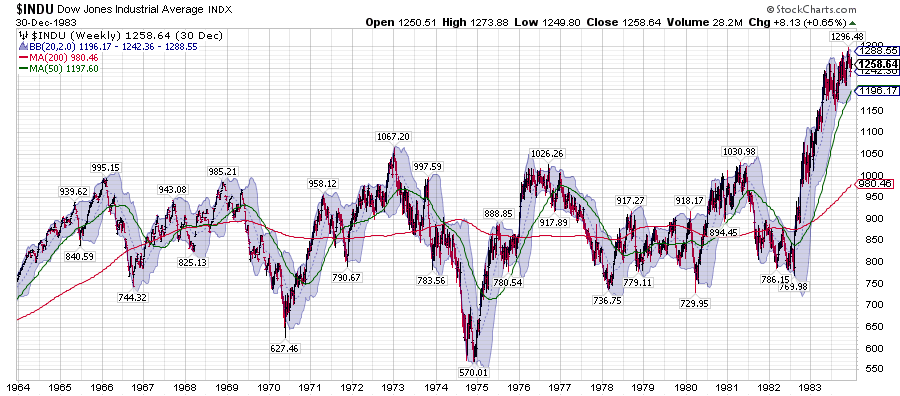
| | | DJIA 1000 was an area we came with in 5 points of in early 1966 after a very long secular bull market. It took 8 year to first be able to break above Dow 1000 and then another almost 9 years to decisively break above it and not look back in late 1982 This was with 2 two head fakes above 1000 with bear markets occurring afterward.

The 1964 to 1984 Dow weekly
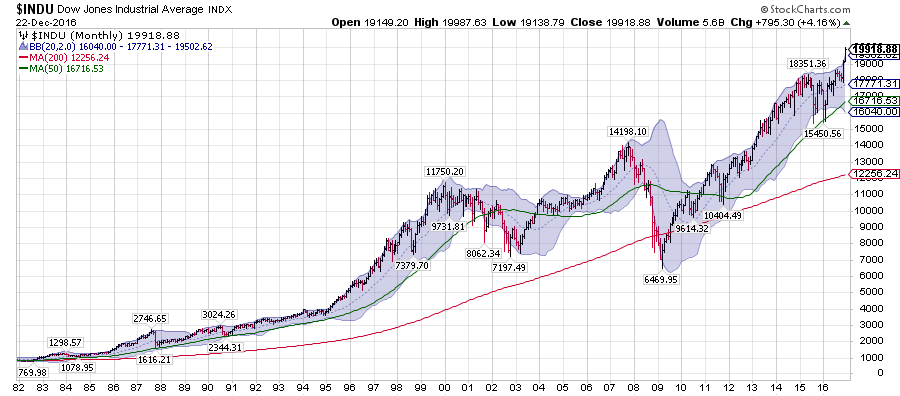
After another 18 year very long secular bull market the DJIA breaks 10K in 1999 and then goes back and forth through it a number of times in subsequent 5 years, before moving significantly above it to 14198 and then the liquidation Great Financial Crisis dragged it all the way back 6469 in early March of 2009.
cnbc has been doing an almost hour long piece with the perspective that the average investor has missed the Trump rally, they did an on the street interviews with people who were not invested..
That's a big reason why when the DJIA closes over 20K it will get the "Man on the street" thinking about getting more involved in the market.
The Dow is has this funky .1495 divisors of the price move of each dollar in the 30 stocks. And no professionals and few analysts use the DJIA as the metric for market expectations, but it has that historical ring to the general public... and 20K is a very big round number.
So historically these round numbers are sticky points. and have been the area's of tops.
Is this time the JOKER in the DECK where the DJIA is able to get above the Dow 20K level and it and the broader US indices like the SPX, Nasdaq, RUT go significantly higher as the central bankers decade long liquidity pump gravitates to US and Japanese stocks assets (which is a very contrary place to be) or do we see some strength in Q1 and then move into a consolidation mode for the balance of the year.
Among some of the most seasoned Market Wizards, Global Macro money managers the "cognoscenti" opinion seems to be about split down the middle, which is healthy and I would say leads to the bull side.... we are probably set up for a classic 7th year in the decennial pattern with a really rambuctious wild rally higher into Oct and then a big downside break... think 1957, 1967, 1987, 1997 (thai Bhat pac-rim crash) and 2007.
perhaps DJIA 25K will be more of a level that acts as a multiyear barrier the way the the 1000 level did in 1966 and after that.
There are way too many real world variables and possibilities in terms of Brexit and Brexit being the opening salvo of more and more countries voting to leave the EU and the EUR currency.... how quickly do global interest rates rise, How aggressive is congress in fighting the debt ceilings which would work against stronger stock performance, What happens with China's debt bubble... does it go into overtime and inflate more; geopolitical extreme black swans... The possible GREEN SWAN of a Republic administration that is super business friendly and creates powerful economic growth...that is an outcome that is not widely viewed as possible... Their does seem to be an exceptional amount of cash and assets that can be reallocated to US equities.
JJP |
|


