| | S cientists Find Climate’s ‘Cause Of Causes’…Highest Solar Activity In 4000 Years Just Ended…Cooling Begins In 2025
By Kenneth Richard on 12. January 2017
“It is generally accepted that the climate warms during periods of strong solar activity (e.g., the Medieval Warm Period) and cools during periods of low solar activity (e.g., the Little Ice Age).” — Lyu et al., 2016 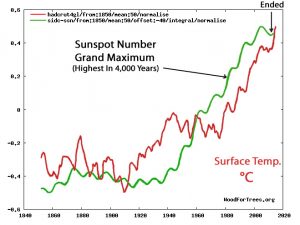
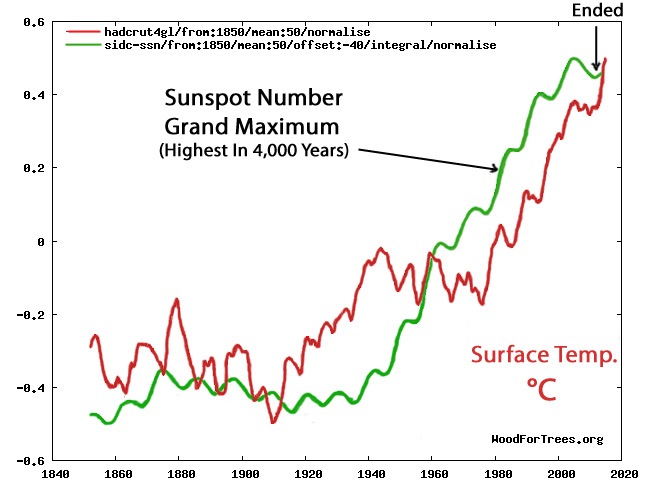
Graph Source: WoodForTrees.org
Scientists are increasingly tuning out the claims that the Earth’s temperatures are predominantly shaped by anthropogenic CO2 emissions, or that future climate is destined to be alarmingly warm primarily due to the rise in trace atmospheric gases. Instead, solar scientists are continuing to advance our understanding of solar activity and its effect on the Earth system, and their results are progressively suggestive of robust correlations between solar variability and climate changes.For example, in 2016 alone, there were at least 132 peer-reviewed scientific papers documenting a significant solar influence on climate. Among them there were 18 papers that directly connected centennial-scale periods of low solar activity (the Little Ice Age) with cooler climates, and periods of high solar activity (the Medieval Warm Period and the Modern Warm Period [20th Century]) with high solar activity levels. Another 10 papers warned of an impending solar minimum and concomitant cooling period in the coming decades.
And this trend of scientists linking climate changes to solar forcing mechanisms — and bypassing an anthropogenic explanation — continues to rage on in 2017.A Seminal New Paper Unveils The ‘Cause Of Causes’ Of Climate ChangeNorwegian professors Harald Yndestad and Jan-Erik Solheim have asserted in their groundbreaking New Astronomy paper that
Yndestad and Solheim have been working together on this project for more than 2 years, and although Dr. Yndestad was “skeptical about the idea of ??sunspots as climate indicators” initially, the two discovered “for the first time” a strong long-term correlation between Total Solar Irradiance (TSI) and sunspots for periods of 84 and 210 years, confirming the “ Cause of causes” of climate change.
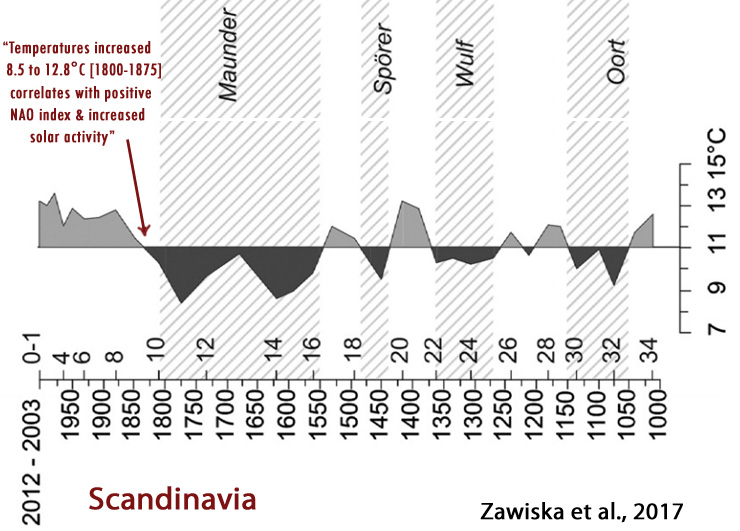
Details can be found in their illuminating new paper. Yndestad and Solheim, 2017Summary“Deterministic models based on the stationary periods confirm the results through a close relation to known long solar minima since 1000 A.D. and suggest a modern maximum period from 1940 to 2015. The model computes a new Dalton-type sunspot minimum from approximately 2025 to 2050 and a new Dalton-type period TSI minimum from approximately 2040 to 2065. … Periods with few sunspots are associated with low solar activity and cold climate periods. Periods with many sunspots are associated with high solar activity and warm climate periods.”1940-2015 Grand Maximum Of Solar Activity, Highest In 4,000 Years, Just Ended“Studies that employ cosmogenic isotope data and sunspot data indicate that we are currently leaving a grand activity maximum, which began in approximately 1940 and is now declining (Usoskin et al., 2003; Solanki et al., 2004; Abreu et al., 2008). Because grand maxima and minima occur on centennial or millennial timescales, they can only be investigated using proxy data, i.e., solar activity reconstructed from 10Be and 14C time-calibrated data. The conclusion is that the activity level of the Modern Maximum (1940–2000) is a relatively rare event, with the previous similarly high levels of solar activity observed 4 and 8 millennia ago (Usoskin et al., 2003). Nineteen grand maxima have been identified by Usoskin et al. (2007) in an 11,000-yr series.”Solar Activity Minimum/Maximum Periods Linked To Colder/Warmer Climates“Twenty-seven grand minima are identified with a total duration of 1900 years, or approximately 17% of the time during the past 11,500 years (Usoskin et al., 2007). An adjustment-free reconstruction of the solar activity over the last three millennia confirms four grand minima since the year 1000: Maunder (1640–1720), Spörer (1390–1550), Wolf (1270–1340) and Oort (1010–1070) (Usoskin et al., 2007). The Dalton minimum (1790–1820) does not fit the definition of a grand minimum; it is more likely a regular deep minimum that is observed once per century or an immediate state between the grand minimum and normal activity (Usoskin, 2013). Temperature reconstructions for the last millennium for the Northern Hemisphere (Ljungquist, 2010) show a medieval maximum temperature at approximately the year 1000 [Medieval Warm Period] and a cooling period starting at approximately 1350 [Little Ice Age], immediately after the Wolf minimum and lasting nearly 500 years, with the coldest period in what is referred to as the Little Ice Age (LIA) at the time of the Maunder minimum. A cold period was also observed during the time of the Dalton minimum. The Maunder and the Dalton minima are associated with less solar activity and colder climate periods. In this investigation, minimum solar activity periods may serve as a reference for the identified minimum irradiations in the TSI oscillations.”Other scientists have just published papers in peer-reviewed journals documenting a robust correlation between solar activity and surface temperatures in the paleoclimate record. Zawiska et al. (2017) have found that the amplitudes of the warming and cooling periods — modulated by changes in solar activity and the North Atlantic Oscillation (NAO) — during the last 1,000 years far exceeded the temperature changes that have occurred since about 1950, or since anthropogenic CO2 emissions began rising at an accelerating pace. For example, these scientists point out that within a matter of 100 years (1050-1150 to 1150-1250), summer temperatures rose from 9.2°C during a low solar activity period (Oort Minimum) to 12.0°C in concert with the subsequent rise in solar activity.Zawiska and colleagues also point out that the rise in modern era temperatures began around 1800, not the 20th century. In fact, they find that temperatures rose by 4.3°C (from 8.5°C to 12.8°C) within 75 years starting at the beginning of the 19th century (+0.57°C per decade), and this warming “correlates with the positive NAO index and increased solar activity.” The authors further indicate that the warming in the 20th/21st centuries has been “less pronounced” by comparison.During the 19th century, of course, anthropogenic CO2 emissions rates were but a tiny fraction of what has been observed since the mid-20th century, strongly suggesting that temperature changes associated with natural variations in atmospheric/oceanic cycles (NAO) and solar activity far exceed the forcing strength of anthropogenic CO2 emissions. Zawiska et al., 2017Summary“The chironomid-based temperature reconstruction from Lake Atnsjøen in Eastern Norway with mean resolution of 30 years provided evidence that large-scale processes, such as the NAO fluctuations and solar activity modified local climate, and subsequently affected lakes functioning. The three minor cooling periods were reconstructed in the first half of the Millennium: 1050–1150, 1270–1370, 1440–1470 CE, that coincide with solar activity minima: Oort, Wulf, and Spörer respectively. Furthermore, a two peaked cooling period in the second half of the Millennium was identified that coincided with the LIA. These changes co-occurred with the prevailing negative NAO index.”Cold Periods (Temp. Average 9.2 °C) Correlate With Low Solar Activity, NAO“At 1050–1150 CE the first of the short-term cooling periods of the last Millennium began and the mean July temperature in the Lake Atnsjøen region dropped to 9.2 °C. The beginning of this cooling coincided with the Oort solar activity minimum. The reconstructed climate deterioration agrees very well with temperatures revealed for Europe (PAGES 2k Consortium, 2013) and Finland (Luoto and Helama, 2010), and partly with tree-ring based temperature trends from Northern Sweden (Osborn and Briffa, 2006). … The climate cooling around 1100 CE has been observed also in Northern America, Russia and Central Asia (Osborn and Briffa, 2006; Wanner et al., 2008), but intrestingly not in Greenland (Osborn and Briffa, 2006). … The beginning of the 1270–1370 CE cooling coincide with Wulf solar activity minimum suggesting that the climate was responding to Sun activity. The climate cooling synchronous to this solar minimum had almost global range and it has been recorded from Europe, Arctic, North America and Antarctica (Osborn and Briffa, 2006; PAGES 2k Consortium, 2013) but again not in Greenland (Osborn and Briffa, 2006). … The beginning of the 1440–1470 CE cold period is synchronous to the pronounce negative NAO phase (Trouet et al., 2009). … Maunder solar minimum caused a very deep negative NAO index phase (Shindell et al., 2001), which consecutively lead to significant drop in the reconstructed temperature.”Warm Periods (Temp. Average 12°C) Correlate With High Solar Activity, NAO “According to presented reconstruction, climate shifted towards warmer conditions during 1150–1250 CE, as mean July temperature raised to 12 °C. Studies from Finland and Sweden also indicate short climate warming around 1200 CE (Luoto and Helama, 2010; Osborn and Briffa, 2006) … The above described time interval 1000–1250 CE coincides with the MCA [Medieval Climate Anomaly] that occurred around 950–1250 CE and was regarded as a generally warmer and drier period (Mann et al., 2009).The temperature reconstruction from Lake Atnsjøen indicates that recent and ongoing climate warming began already in 1800 CE following the LIA. Temperatures increased very fast, from 8.5 to 12.8 °C during the first 75 years, but in the 20th century the increase became less pronounced.The warming at the beginning of 19th century in the region of Lake Atnsjøen coincides with a reconstruction from Southern Finland (Luoto, 2013), and a record from Northern Sweden (Osborn and Briffa, 2006). Its onset correlates with the positive NAO index and increased solar activity.” 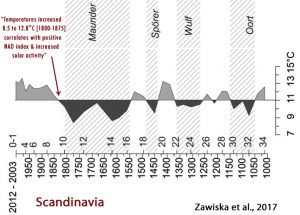
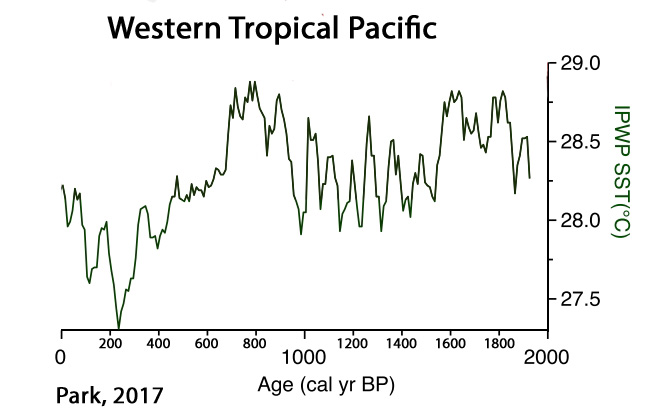
Another scientist just published a paper in the journal Palaeogeography, Palaeoclimatology, Palaeoecology that also concludes solar activity drove variations in the East Asian Monsoon (EAM), El Niño Southern Oscillation (ENSO), and the centennial-scale cooling periods corresponding to the Oort, Wolf, Spörer, and Maunder sunspot minimums.In his graph of Western Tropical Pacific sea surface temperatures (SSTs), notice how Park (2017) also documents a dramatic warming event occurred beginning about 1800, with the SST warming rate and amplitude far exceeding that which has occurred in recent decades, once again demonstrating the lack of correlation between anthropogenic CO2 emissions and surface temperatures relative to natural variation. Park, 2017“Late Holocene climate change in coastal East Asia was likely driven by ENSO variation. Our tree pollen index of warmness (TPIW) shows important late Holocene cold events associated with low sunspot periods such as Oort, Wolf, Spörer, and Maunder Minimum. Comparisons among standard Z-scores of filtered TPIW, ?TSI, and other paleoclimate records from central and northeastern China, off the coast of northern Japan, southern Philippines, and Peru all demonstrate significant relationships [between solar activity and climate]. This suggests that solar activity drove Holocene variations in both East Asian Monsoon (EAM) and El Niño Southern Oscillation (ENSO). In particular, the latter seems to have predominantly controlled the coastal climate of East Asia to the extent that the influence of precession was nearly muted during the late Holocene.” 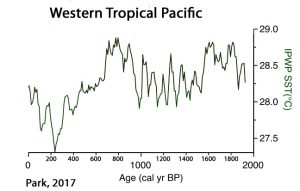
The year has just begun, and, in addition to the 3 papers introduced above, there have already been several other 2017 scientific papers published in scientific journals documenting a robust correlation between solar activity and climate changes. With the rapidly growing body of evidence that has been accumulating within the last few years, it can no longer be said that it is “settled” science that the Sun and its modulation of natural atmospheric/oceanic oscillations (NAO, ENSO, PDO, AMO) has only a negligible influence on climate. The claim that we human beings predominantly drive climate changes with our CO2 emissions is increasingly being challenged, if not categorically undermined, in the peer-reviewed scientific literature. Sun et al., 2017“[A]t least six centennial droughts occurred at about 7300, 6300, 5500, 3400, 2500 and 500 cal yr BP. Our findings are generally consistent with other records from the ISM [Indian Summer Monsoon] region, and suggest that the monsoon intensity is primarily controlled by solar irradiance on a centennial time scale. This external forcing may have been amplified by cooling events in the North Atlantic and by ENSO activity in the eastern tropical Pacific, which shifted the ITCZ further southwards. The inconsistency between local rainfall amount in the southeastern margin of the QTP and ISM intensity may also have been the result of the effect of solar activity on the local hydrological cycle on the periphery of the plateau.” 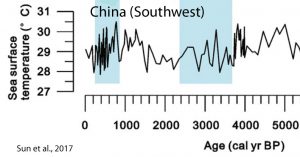
Deng et al., 2017“The results indicate that the climate of the Medieval Climate Anomaly (MCA, AD 900–1300) was similar to that of the Current Warm Period (CWP, AD 1850–present), which contradicts previous studies. … As for the Little Ice Age (LIA, AD 1550–1850), the results from this study, together with previous data from the Makassar Strait, indicate a cold and wet period compared with the CWP and the MCA in the western Pacific. The cold LIA period agrees with the timing of the Maunder sunspot minimum and is therefore associated with low solar activity.” Zielhofer et al., 2017“Western Mediterranean Holocene record of abrupt hydro-climatic changes … Imprints of North Atlantic meltwater discharges, NAO and solar forcing …Early Holocene winter rain minima are in phase with cooling events and millennial-scale meltwater discharges in the sub-polar North Atlantic. … [A] significant hydro-climatic shift at the end of the African Humid Period (~5 ka) indicates a change in climate forcing mechanisms. The Late Holocene climate variability in the Middle Atlas features a multi-centennial-scale NAO-type pattern, with Atlantic cooling and Western Mediterranean winter rain maxima generally associated with solar minima.” Matveev et al., 2017“An increase in atmospheric moisture for the warm period of the year (May–September) since 1890s, and mean annual temperatures since the 1950s was identified. During the same time period, there was a marked increase in amplitude of the annual variations for temperature and precipitation. … These fluctuations are consistent with 10–12-years Schwabe–Wolf, 22-years Hale, and the 32–36-years Bruckner Solar Cycles. There was an additional relationship found between high-frequency (short-period) climate fluctuations, lasting for about three years, and 70–90-years fluctuations of the moisture regime in the study region corresponding to longer cycles.”
- See more at: notrickszone.com
|
|