Copper -- Daily Weekly and 45 Year Monthly charts with Fibonacci ratio's and trendlines.
18 month daily copper chart with FIBS

10 Year Copper weekly chart with Fibs..... bullish chart copper is getting ready to explode upward through it's 200 week Moving Average..... That will bring long term trend traders in.

45 year Monthly Copper chart with FIB and buy signal on the RSI moving average crossover buy signal.

Message 30867069
-------------------------------------------------------------
Message 30830274
here is my post from 11/7/17 where I was positioned for the bullish breakout in the copper market..
To: John P who wrote (18465)11/7/2016 4:21:23 PMFrom: John P3 Recommendations Read Replies (1) of 18684 Global conditions improving.... the highly impressive rally in Copper has really surprised me and is reiterating the theme that The FED and the CB's are keen to let inflation run hotter and higher than the 2% target range.
The Dec Futures have had a huge rally today this comes after Copper prices rallied for the 10th consecutive day, their longest winning streak in at least 28 years, as traders bet that the global economy may be picking up after a long period of sluggish growth.
Many investors view copper as a bellwether for economic activity since the metal is a key component in a variety of goods, from refrigerators to smartphones. Other base metals, such as aluminum, nickel and zinc, also have mounted big rallies in recent days.
Look at this very bullish ascending triangle that we will be breaking out of.

The current 10-day winning streak is the longest for the front-month copper contract in available data going back to 1988. This surpasses a nine-day stretch that ended on Dec. 21, 2004.
Recent signs that manufacturing and inflation in China and the U.S., the world’s two largest economies, may have turned a corner have helped drive up copper prices.
China’s industrial sector picked up last month, with an official gauge of factory activity rising to its highest level in two years, data showed Tuesday. In the U.S., a gauge of factory activity rose in October, a sign that manufacturing could be stabilizing after two years of challenging conditions.
Tai Wong, head of base- and precious-metals trading at BMO Capital Markets, said copper stockpiles tracked by the London Metal Exchange have declined 10% since Oct. 25. Falling inventories are generally considered a positive sign for demand, as copper is moved out of warehouses for consumption.
The 10 year weekly copper chart is showing that the RSI MA system is on a solid buy signal, as is the Money Flow index, the copper market has created a bottom with a very bullish ascending triangle that we are in the process of breaking out of and this coincides with the downtrend line which would also be taken out given this Bullish situation.
China's economy which has been very appears that it will continue be able to expand as witnessed by the 29% increase in car sales in Oct.
Besides last month’s manufacturing data, Mr. Dragosits pointed to Chinese car sales, which jumped 29% in October for the biggest gain since January 2013, as well as other indicators that show a higher level of financing activity from banks.
China, the world’s second-largest economy, also is its biggest commodity consumer, accounting for some 45% of the demand for copper.

and looking at the 18 month daily chart of copper we see a price rally that is the most dynamic in years, The strongest Momentum on the RSI , highly impressive money flow into the red metal and the accumulation/ distribution reversing into a bullish accumulation situation.
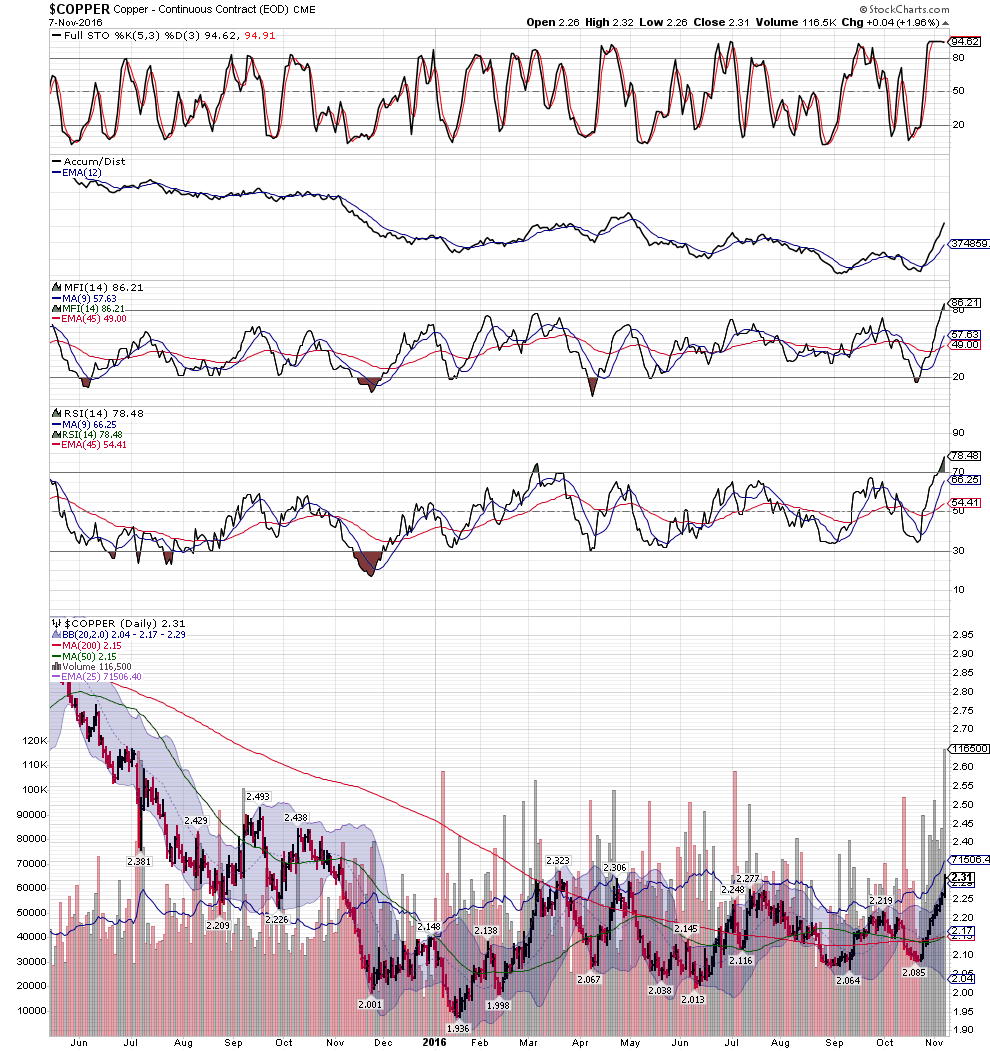
This dovetails with the Bullish stock market rally we were suggesting was unfolding when we commented on early on Sunday evening.
JP |


