| | |
HI TJ,... I start out discussing a bloomberg post on US bond sales but quickly get to the point of focusing on China's burn rate on their Foreign currency reserves and the impressive evidence that when you look at the IMF's showing of foreign exchange holdings 2/3 or the world's reserves are in USD........ I also go on to outline how global currency reserves that went up 5 fold in the 1st decade of this century had an inflection point 3 + years ago and have been falling around the globe.
Bloomberg's analysis on the reason for US debt sales is incorrect in the reason they are targeting.
The selling is occurring is because the foreign countries are tapped out and need the money. Pimco's tony crescenzi spent a couple of hours on squawk box last friday and Pimco which is owned by German mega Global Reinsurer Allianz..... has offices in 13 countries and Crescenzi was commenting that US debt buying was active with inflows due to the huge positive interest rate differentials.
That Bloomberg article actually mentioned hedged bond and currency flows and that is a zebra of another stripe.
The Global Capital markets begin with the currency markets... 5.3 Trillion dollars on the move everyday... all other markets and prices are derived from what the cost basis in the individual currencies.
the USD is really relatively stable in the bigger picture.... with the USD it is very important to keep this key paragraph in mind
The Bottom line that right now the USD is the only game in town... the world that is.
Message 30977284
Here’s how it plays out: As the world’s dominant reserve currency, the dollar has no peer. International Monetary Fund data show that the greenback accounts for 63.3 percent of global foreign-exchange reserves, with the euro next at 20.3 percent, followed by the British pound and Japanese yen, both at 4.5 percent. That means that in times of crisis, the dollar benefits from global investors seeking a haven, even if the strife and the the uncertainty emanates from the U.S.
It’s possible that a trade war would drive flows into the dollar, putting upward pressure on the currency at the expense of other exchange rates. That would be on top of the natural demand for the greenback created by the anticipation of significant fiscal stimulus floated by the Trump administration and a faster pace of interest-rate increases by the Federal Reserve.
the USD is the only game in town..... the EUR is the second game in town with a 20% weighting by the IMF... I have been talking about it going down for weeks... and it's been weakening against the USD, the CHF - swiss Franc... and even the yen. Greece is actively talking about leaving the EUR and pegging to the USD. The EUR has such structural problems, how many contries are upping their IMF reserves in EUR.... none... The GBP... with Brexit the Pound has lost 20% this past year and faces significant uncertainties... no countries want anymore pounds. Japan has a 350% debt to GDP ratio... worst in the world for a major economy.... the yield is nothing.... country has horrible aging demographics and is trying to climb out of 25 lost years of economic growth.
The Chinese have been burning up A Trillion and a half USD of their foreign currency returns by attempting to support their currency and still capital flight is a major issue and the currency has been weakening against a basket of currencies.
and global currencies reserves that expanded continuously from 2002 until about 3 years ago have been contracting for the past 2 plus years...... these are the supertanker trends that unfold in secular moves.
Message 30451689
here are the global financial leaders saying that global protectionism is coming in Feb 2016..... when Trump was not seen by anyone as being the current president, so do not blame it on him......
International financial system on the verge of an “epoch-defining seismic rupture” ---
Chancellor: Heed the threats to globalization
By Edward Chancellor February 9, 2016
Is the international financial system on the verge of an “epoch-defining seismic rupture” accompanied by a return to global protectionism? This warning was made a couple of years ago by Claudio Borio, the respected head economist at the Bank for International Settlements. Since that time, emerging markets have crashed and some countries have resorted to capital controls to protect their currencies. The last time globalization collapsed was in the 1930s. Looking back at this disastrous period, it is possible to identify some disturbing parallels.
and this is in that same article that I linked to as I had several of my posts over time included because it's an ongoing snowballing story
Once Over $12 Trillion, the World’s Reserves Are Now Shrinking 04/05/ 2015
(This is a big deal .. This is the global downshifting in the creation of what is already half a trillion dollars and will continue to trend downward with another 1 to 2 Trillion Dollars of Reservesleaving the system due to the change in momentum and the wildly wicked world of Negative interest rates which we are seeing in way too many places. such as Switzerland, Sweden Denmark and in other aspects of our Gobal Macro Financial Structure........JJP)
The decade-long surge in foreign-currency reserves held by the world’s central banks is coming to an end.
Global reserves declined to $11.6 trillion in March from a record $12.03 trillion in August 2014, halting a five-fold increase that began in 2004, according to data compiled by Bloomberg. While the drop may be overstated because the strengthening dollar reduced the value of other reserve currencies such as the euro, it still underlines a shift after central banks -- with most of them located in developing nations like China and Russia -- added an average $824 billion to reserves each year over the past decade.
Beyond being emblematic of the dollar’s return to its role as the world’s undisputed dominant currency, the drop in reserves has several potential implications for global markets. It could make it harder for emerging-market countries to boost their money supply and shore up faltering economic growth; it could add to declines in the euro; and it could damp demand for U.S. Treasury bonds.
“It’s a big challenge for emerging markets,” Stephen Jen, a former International Monetary Fund economist who’s co-founder of SLJ Macro Partners LLP in London, said by phone. They “now need more stimulus. The seed has been sowed for future volatility,” he said.
China Sells
Stripping out the effect from foreign-exchange fluctuations, Credit Suisse Group AG estimates that developing countries, which hold about two-thirds of global reserves, spent a net $54 billion of this stash in the fourth quarter, the most since the global financial crisis in 2008.
China, the world’s largest reserve holder, together with commodity producers contributed to most of the declines, as central banks sold dollars to offset capital outflows and shore up their currencies. A Bloomberg gauge of emerging-market currencies has lost 15 percent against the dollar over the past year.
China cut its stockpile to $3.8 trillion in December from a peak of $4 trillion in June, central bank data show. Russia’s supply tumbled 25 percent over the past year to $361 billion in March, while Saudi Arabia, the third-largest holder after China and Japan, has burned through $10 billion in reserves since August to $721 billion.
Euro’s Decline.....
The 3 year Wyckoff has the USD back above it's breakout area that we first visited in mid March of 2015 at 100.71

The EUR has been drifting lower on a continous basis since it made a double top at 1.08 2 weeks ago.
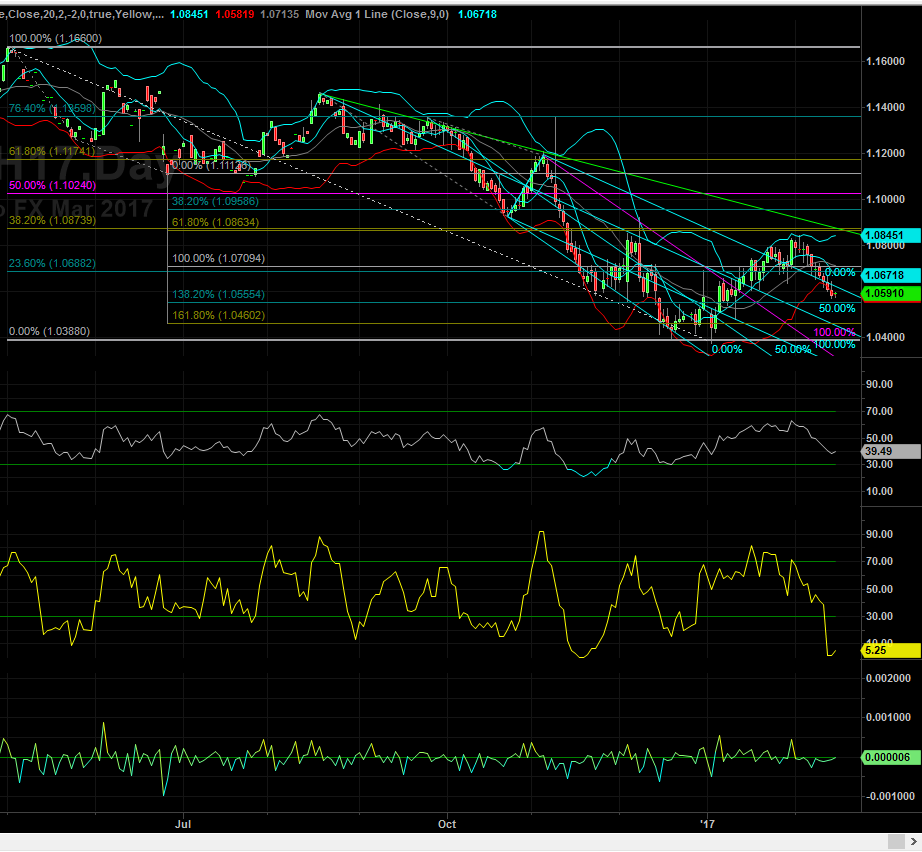
None of the global currencies is particularly distinguishing itself.
a USD Futures chart. I posted this on one the day that we reached the 1.618 time retracement and said it should be a continuation of trend based on what occurred on the 1.382 time period based on the time cycle of the May low of last year and then the August low .. which was a complete upwave and pullback into pattern and cycle low.
You can get an idea of the prices by looking at the levels on the right hand side..... that were calculated by the Fibonacci range that has it's start point on the May 5th 2016 low at 91.88 basis the cash index and the all time high in the USD at almost 104
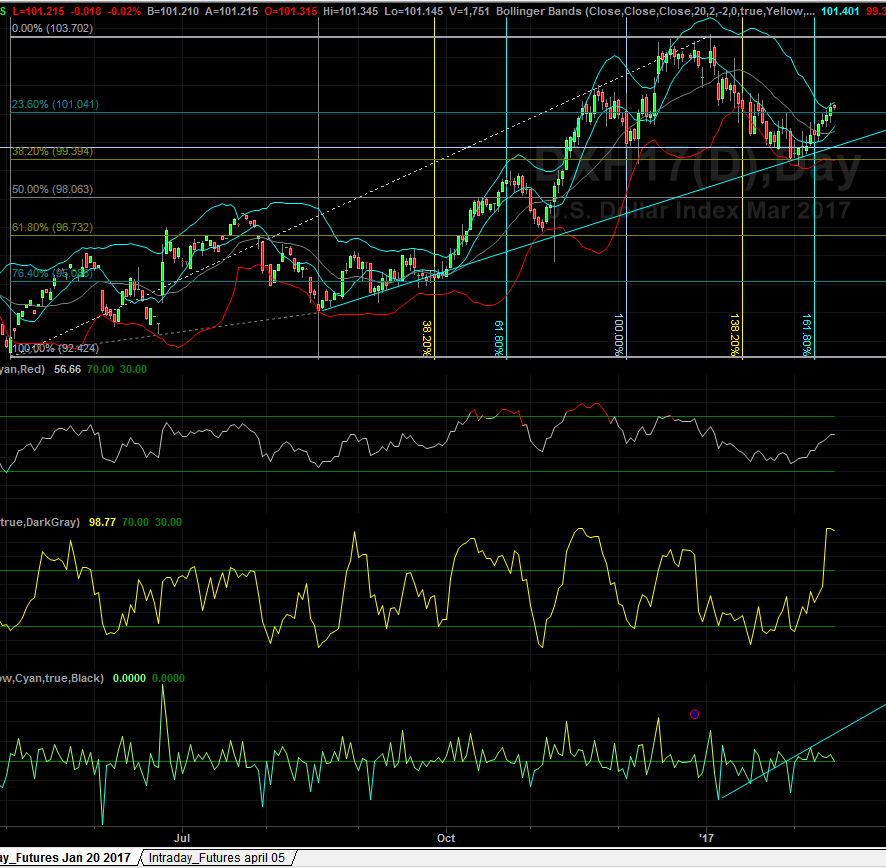
this is also in line with my analysis dating back to Mid March of 2015
Message 30939865
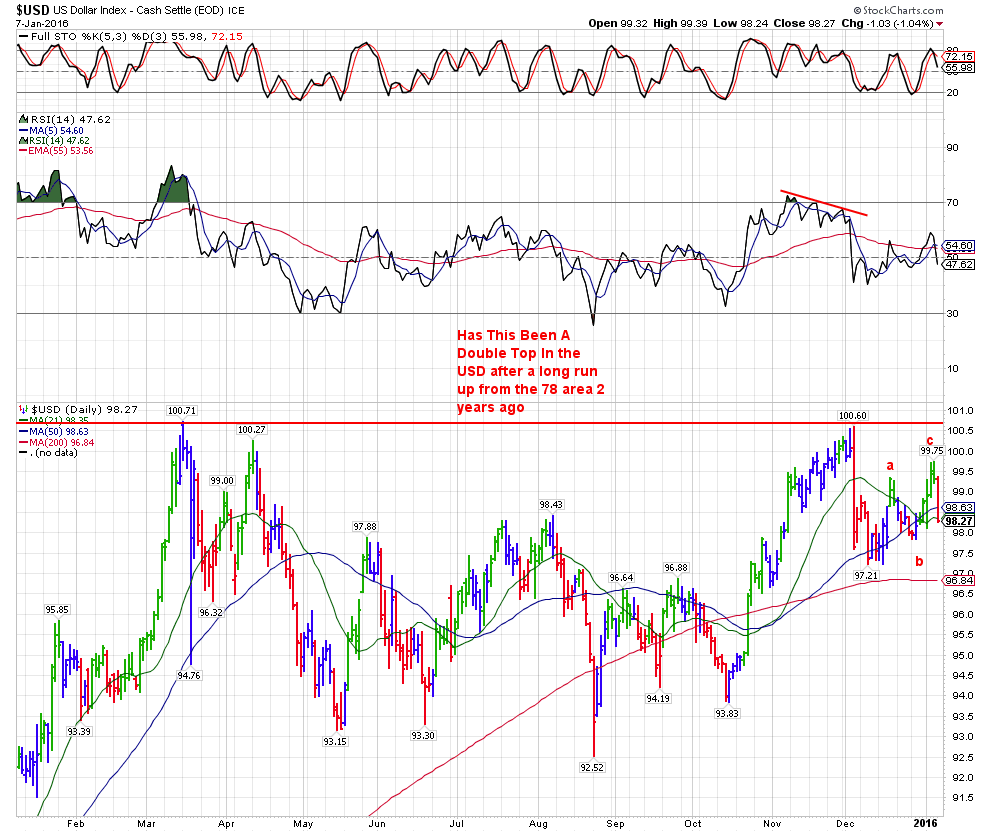
and to reiterate that I have not been a perma bull on the USD here is my post from early 2016 when I raise the prospect of a potential double top in the USD and showed a very little bit of Elliott counting supporting a move lower....... The markets were hyper bullish on the USD at the time and that teed me up nicely to go contrarian to the excessive Bullishness.. and needless to say after writing that in early January of 2016 .... we gave the market 5 months and at the bottom of the trading range we witnessed significant bearishness.
on the USD
| To: Hawkmoon who wrote (17560) | 1/7/2016 10:59:42 PM | | From: John P | 4 Recommendations Read Replies (2) of 18744 | | Wow has the USD put in a Double top as it clicked back down with a vengeance today...... we've been seeing a flight to safety in the $/JPY.... if the USD has topped and breaks down that would be a catalyst for a change of direction in other markets globally... it would possibly be positive for crude.
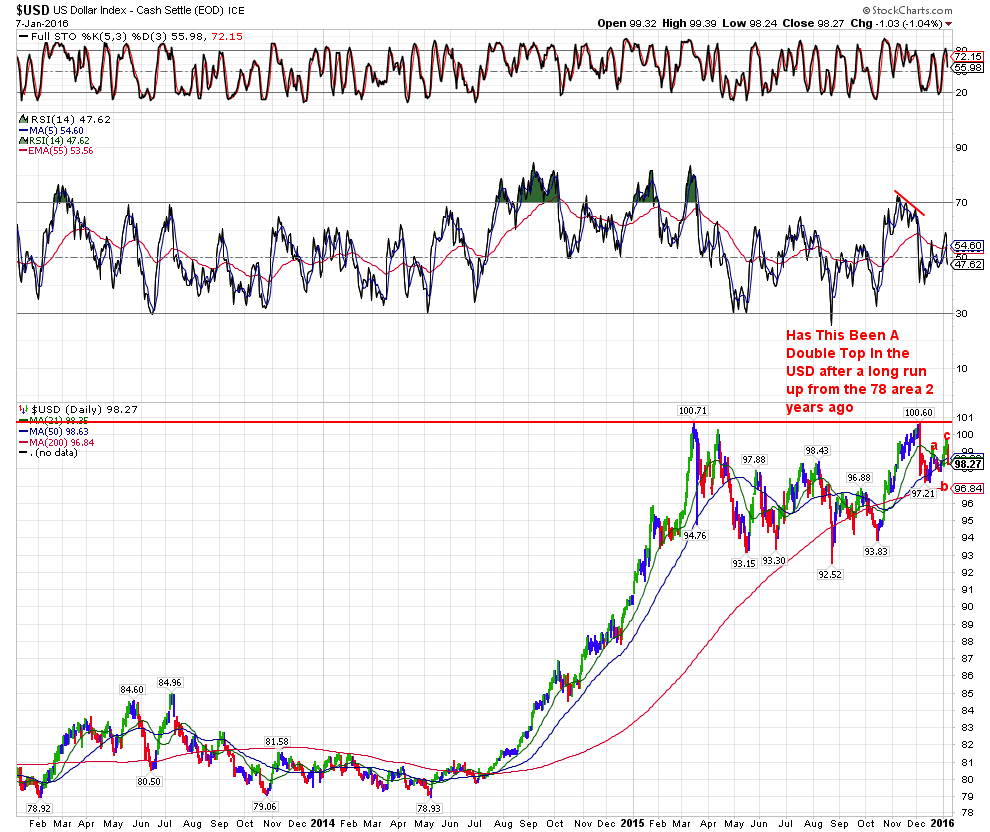
the 3 year chart
and since China is the RED SWAN that will ultimately create our next global macro bout of economic upheaval
I am posting this David Stockman piece.
| To: robert b furman who wrote (17235) | 10/27/2015 9:04:40 PM | | From: John P | 6 Recommendations Read Replies (1) of 17761 | | Red Swan Descending
by David Stockman • October 20, 2015
davidstockmanscontracorner.com
The proverbial peddlers of Florida swampland can now move over. They can’t hold a candle to the red suzerains of Beijing.
The latter had drawn a line in the sand at 7.0% GDP growth. Conveniently enough, the “consensus” estimate of so-called street economists was pegged at 6.8% for Q3,thereby giving authorities one thin decimal point through which to thread a “beat” at 6.9%.
By golly they did it!
Even then, China’s Ministry of Truth had to fiddle down the GDP deflator to negative 0.5% (for the second time this year) in order to hit the bulls eye. And that’s exactly the point.
No real world $10 trillion economy plagued with all of the turmoil evident in China’s whipsawing trade data or its volatile real estate development sector or its faltering rust belt and commodity-based industries can possibly deliver absolutely stable GDP numbers to the exact decimal point quarter after quarter.
In fact, the odds that these reports represent anything other than goal-seeked propaganda are so overwhelmingly high that they perforce raise another more important question. Why does Wall Street and its servile financial press not issue a loud collective guffaw when they are released?
But no, the Wall Street Journal took it all very seriously, noting both the “beat” and China’s claim that the “miss” wasn’t a miss at all:
The better-than-expected result—a Wall Street Journal survey of 13 economists forecast a median 6.8% gain—is likely to renew debate over the accuracy of China’s growth statistics…….Speaking at an event to promote entrepreneurism in Beijing on Monday, Premier Li Keqiang said “even though it was 6.9%, it is still a growth rate of around 7%.”
Right. China’s #2 communist boss is out promoting the “enterprenurial spirit” while emitting central planning propaganda to the decimal point.
You might find the irony exceptionally rich, but there is a larger message. Namely, the true size of China’s economy is unknowable to the nearest trillion or even several trillions.But that does not prevent most of Wall Street from taking seriously each and every word of China’s self-evidently clueless statist rulers spouting growth rates to the decimal point.
In truth, Wall Street has become so intellectually addled from its addiction to central bank enabled gambling that it no longer has a clue about what really matters. That’s why thenext crash will come as an even greater surprise than the Lehman meltdown, and will be far more brutal and uncontainable, as well.
Yet the evidence that a China-led crash is on its way is hiding in plain sight. And what is being blithely ignored is not merely the blatant inconsistencies in its economic numbers—–such as the fact that electricity consumption has grown at only a 1.3% rate over the past year——or that its commerce with the outside world has shrunk drastically, with imports down by 23% and exports off by 3-6% in recent months.
Instead, the evidence that China is a slow-motion trainwreck lies in the very consistency of its Beijing-cooked numbers. Apparently, no one has told its credit-happy rulers that printing precise amounts of new GDP quarter after quarter by issuing credit at double the rate of nominal income growth will eventually result in the mother of all deflationary collapses.
Stated differently, if the pattern of debt versus GDP shown below is pursued long enough, the world’s greatest open air construction site will fall silent. Everything which can be built will have been delivered; any cash flow which can be encumbered with more debt will have been levered-up; any pretense that financial institutions are solvent will have given way too soaring defaults; and the Wall Street delusion that the primitive central planners of red capitalism had a iron grip on China’s runaway expansion will have been revealed as a snare and delusion.
Accordingly, the only thing that really counted in yesterday’s release was that credit is still growing at nearly 12% or at 2X the 6.2% gain in nominal GDP. And as is also evident in the chart, this massive and aberrational debt versus income gap has been underway as far back as the eye can see.
Indeed, its goes all the way back to Mr. Deng’s moment of enlightenment 25 years ago. That’s when he discovered a printing press in the basement of the PBOC and concluded that communist party power might better be preserved by running these presses red hot than by Mao’s failed dictum that power descends from the white hot barrel of a gun.
In any event, why in the world would anyone in their right mind think this crucial chart can be extended toward the right axis much longer. Assume 10 more years of 12% credit growth, for example, and China will have $90 trillion of total debt or 50% more than the already staggering amount carried by the US economy.
At the same time and given that China’s nominal GDP growth is descending in Gartman fashion from the upper left to the lower right, assume the very best outcome for nominal income. That is, posit that somehow China manages to achieve ten more years of this quarters’ 6% nominal growth. So doing, you get a mere $17 trillion of GDP.
Everywhere and always, however, a 5X total leverage ratio on an economy is a recipe for crushing deflation. In fact, it has never happened before in modern times except for Japan after 1990; and Japan at least had some semblance of functioning markets separate from the state and the rule of commercial law, contracts and bankruptcy.
By contrast, when China fully plunges into its inexorable deflationary spiral the rulers of red capitalism will have no choice except to resort to Mao’s preferred instruments of rule—–paddy wagons and machine guns—-in order to quell an outraged citizenry. After all, Mr. Deng told China’s newly ascendant capitalists that it is glorious to be rich, but did not explain that printing press prosperity ultimately results in a crack-up boom.
Stated differently, the recent 18-month rise and then overnight collapse of $5 trillion of phony market cap in the Chinese stock market gave rise to utter panic and mindless expediency in Beijing, including a de facto bailout of billionaires. China’s red rulers apparently feared that the 90 million angry stock market speculators would be no match for its 70 million party cadres——especially since most of the latter were foremost among the former.
Yet what will happen when China’s hideously inflated real estate and land values succumb to the deflationary wringer? And hideous is not too strong a word: in many urban areas housing prices have reached 15-30X the median income.
Well, there are 65 million drastically over-priced, empty apartments in China because its rulers told speculators and the rising middle class that housing prices could never fall——that they were the next best thing to a piggy bank. Accordingly, the last phase of China’s madcap construction boom is likely to be a manic spurt of prison building to accommodate the millions of irate citizens who are destined to experience China’s turbo-charged version of 1929.

The other number number in the Q3 release that has been drastically misinterpreted is the reported 10.6% growth of fixed asset investment. Needless to say, this was described as “disappointing” when it is actually a screaming symptom of China’s terminally deformed economy. If it had any hope of avoiding a crash landing, fixed investment in its fantastically overbuilt public facilities and industrial capacity would be sharply negative, not still growing in double digits.
Owing to the cardinal error embodied in Wall Street’s self-serving rendition of Keynesian economics, however, China’s fatal dependence on erecting economic white elephants and what amount to public pyramids in the form of unused airports, train stations, highways and bridges, is given hardly a passing nod. That’s because it is assumed that some way or another China will make the transition to a services and consumption based economy just like the good old shop-till-they-drop US of A.
Let’s see. When China finally stops its borrowing binge, these putative shoppers will need to finance their purchases out of current incomes. Yet is not the overwhelming share of household income in China currently earned from the supply chain for fixed asset investment and construction and from the export of cheap goods to already saturated and debt-besotted DM markets?
Just consider the fantastical reality that China’s 2 billion ton cement industry produced more in three years than did the US industry during the entire 20th century. When they finally stop building roads, apartments and factories, therefore, it is not just the cement kilns which will shutdown, but a whole network of gravel haulers, chemical plants, cement truck fleets, construction equipment suppliers, work site service vendors and much more reaching deep into the interstices of China’s hothouse economy.
Likewise, when rebar and other construction steel demand collapses and the rest of the world throws up barriers to China’s surging steel exports, as it surely will and is already doing, the ricochet effects on China massively overbuilt 1.1 billion ton steel industry will be far-reaching. The incomes of coal barons and blast furnaces workers alike have already taken a pasting, and the downward spiral is just getting started.
And wait until China’s newly minted auto dealer lots become backed-up with unsold cars as far as the eye can see. Then its 25 million unit auto industry will tumble into a depression unlike anything since 1929 when Detroit’s production plunged from 6 million cars/year to less than 2 million.
All of those suddenly unemployed auto, steel, rubber, glass, upholstery etc. workers did, in fact, economically “drop”. But it wasn’t from an excess of shopping!
In short, the affliction of Keynesian economics brought many ills to the modern world, but repeal of Say’s Law was not among them. You can have a one-time credit party, but when it inevitably ends, consumption spending defaults to that which can be financed from current incomes. Consumption is the consequence of production and income, not its cause.
Yet crack-up booms eventually destroy the bloated and unsustainable incomes generated in the raw materials, capital goods and consumer durables sectors during the boom phase. Accordingly, even the red suzerains of Beijing can not get from here to there. The phantom incomes that resulted from paving nearly half of the Asian continent occupied by 20% of the world’s population must inevitably shrink, meaning that China’s consumption and service spending will falter, too.
Stated differently, China’s red capitalism is the new black swan. There is nothing rational, stable or sustainable about it. Moreover, the consequence of its pending collapse will be literally earth shattering.
That’s because in recent years it has accounted for a lot more than the one-third of global GDP growth conventionally cited. The latter is just a measure of border-to-border economic statistics.
But the second and third order effects are equally large. From the bowels of Australia’s iron ore mines to the top of Dubai’s pointless 100 story office towers, the entire warp and woof of the global economy has been distorted and bloated by the central bank money printing spree of the last two decades, led by the red credit machines of Beijing. Everywhere economies have succumbed to over-building, over-consumption, over-financialization and endless dangerous, unstable speculation.
So forget the cleanest dirty shirt meme or the preposterous Wall Street nostrum that the US economy has been “decoupled” from the rest of the world. That’s unadulterated hogwash, and its means that the stock market and risk assets are heading for a thundering crash.
After the fact, of course, Wall Street will discover that the world economy was unexpectedly taken down when the suzerains of Beijing were unable to perpetuate the Red Ponzi.
But just like last time during the mortgage and housing meltdown it was starring them in the face all along. Here is what happened to the home ATM piggy-bank that fueled the Greenspan Boom and that gave rise to the Wall Street illusion that consumption spending is the motor force of economic life.
From a peak mortgage equity withdrawal rate (MEW) at 9% of DPI or nearly $1 trillion per year prior to the crisis, MEW has been negative ever since. That is, it has subtracted from consumption, not added. Not one in one hundred Wall Street economists could have correctly projected this chart in 2007 when they were slobbering about the goldilocks economy.
Needless to say, when it comes to the wounded elephant in the room this time around—-the tottering edifice of the Red Ponzi——they are still slobbering.
 |
|
|
|
| |
It takes significant time for these events to play out and with the USD and our positive interest rate differentials and our long bull market.... we are witnessing the exponetial phase of new all time highs in the US equity markets.... Because the US has the strongest currency,very strong and positive interest rate differentials on our debt, the most sovent banks... an economy that does is strong enough to support rising rates and the potential for significant regulatory reduction and a reduction and potential simplification in our corporate tax code.
JP |
|
| |
|
|


