" Eli is getting tired of the lies and distortions coming from John Bates and David Rose"
January HADCRUT and David Rose.
Yet another episode in the lamentable veracity of David Rose and the Daily Mail. Sou covered a kerfuffle last month when Rose proclaimed in the Sunday Mail:
"The ‘pause’ is clearly visible in the Met Office’s ‘HadCRUT 4’ climate dataset, calculated independently of NOAA.
Since record highs caused last year by an ‘el Nino’ sea-warming event in the Pacific, HadCRUT 4 has fallen by more than half a degree Celsius, and its value for the world average temperature in January 2017 was about the same as January 1998."
This caused John Kennedy, of the Met Office, to note drily:

Rose was writing 19 Feb, and Hadcrut does indeed take much longer to come out. But it is there now, and was 0.741°C for the month. That was up quite a lot from December, in line with GISS (and Moyhu TempLS). It was a lot warmer than January 1998, at 0.495°C. And down just 0.33°C from the peak in Feb 2016.
And of course it was only last December that David Rose was telling us importantly that "New official data issued by the Met Office confirms that world average temperatures have plummeted since the middle of the year at a faster and steeper rate than at any time in the recent past".
In fact, January was warmer than any month since April 2016, except for August at 0.77°C.
Update. David Rose was echoed by GWPF, who helpfully provided this graph, sourced to Met Office, no less: 
I've added a circle with red line to show where January 2017 actually came in. I don't know where their final red dot could have come from. Even November, the coldest month of the 2016, was 0.524°C, still warmer that Jan 1998.
moyhu.blogspot.com
In related news,
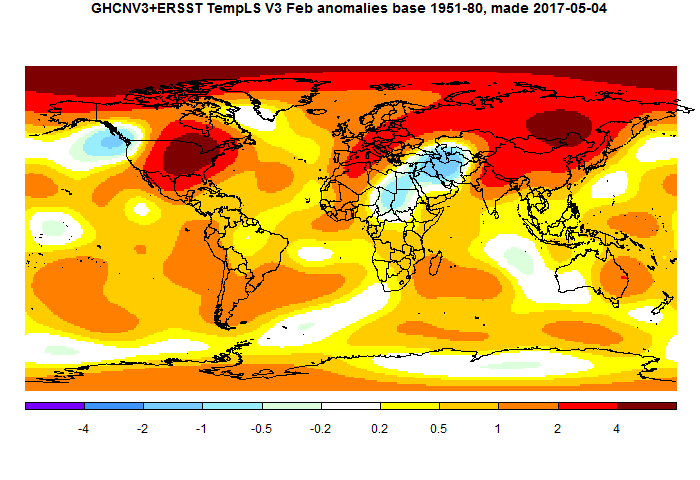
February global surface temperature up 0.106°C.
TempLS mesh posted another substantial rise in February, from 0.737°C to 0.843°C. This follows the earlier very similar rise of 0.09°C in the NCEP/NCAR index, and smaller rises in the satellite indices. Exceeding January, February was record warm by any pre-Nino16 standards.It was warmer (in anomaly) than any month before October 2015.
TempLS grid also rose by 0.11°C. The breakdown plot showed the main contributions from Siberia and N America, with Arctic also warm. The map shows those features, and also cold in the Middle East.
Posted by Nick Stokes at 7:55 AM
moyhu.blogspot.com |


