HI Graham, My post which you responded to back in January 2016..... I had some T/A info on it
but also had this comment on very positive comments on AMZN, and liked GOOGL
on a positive note
AMZN and GOOGL are amazing companies for the long term ..... how do compete with AMZN
----------------------------------------------------------------------------------------------------------------
I was still bearish on Jan 16th 2016 as you could have bought AMZN at like $580, it has a further $100 to fall in the next month, but has sense doubled... although we are again at a juncture of wondering about
valuations, on the market as a whole and especially the NDX top stocks, the FANG stocks, etc.

GOOGL, my other positive mention has also had positive performance....

at the moment I believe that we are are probably seeing a bigger correction in prices in these types of names there are areas of the asset class arena such as the Cryptocurrencies that are every bit as frothy and speculative as the .com and B2B stocks in 1999 heading into March 2000... where there are 285 of these currencies and it is Westworld.... in the era of rising interest rates we have a headwind to these fairly high CAPE levels....
The worldwide Massive liquidity pump has not been shut down and the Cryptocurrencies are actually expanding the money supply as they appreciate in value and more and more of them emerge.
=================================================================================
I have a rather detailed post in which I give evidence that we witnessed a rotating sector stealth bear market from early 2015 into 2016..... From Q1 of 2015 when SPX earnings had stalled out.. we then had 5 consecutive Quarters of negative earnings before we got back on track in Q3 of 2016.
-----------------------------------------------------------------------------------------------------------------------------
I do believe we had a rotating sector stealth bear market that started in some respect in 2014 when world wide global currency reserves peaked and started to contract, and then we had a rotating Stealth bear market starting in some areas in mid 2015 and expanded to impact more of the US stock market in 2015 and into 2016..
Message 31117233
here are some of the relevant points from my post where I show some of the wealth and valuation destruction in the bear market of 2015.... 2016...
The argument can be made that we experienced a stealth bear market in stocks from Mid 2015 into the early 2016 and other parts of this rotating bear market did not end until the Central Banks reversed course on their dire experiment with Negative interest rates in Japan, the Eurozone, Sweden, the Netherlands and
the USA, which only save negative interest rates in places such as New York Trust Bank demanding payments for institutional accounts that wanted to deposit more than $50 Million in accounts with them.
the US did experience multiple rounds of Quantitative Easing and Fed Balance sheet expansion and the Fed Funds rate and 3 month Libor hovered near zero for years after the Great Financial Crisis of 2008-2009.
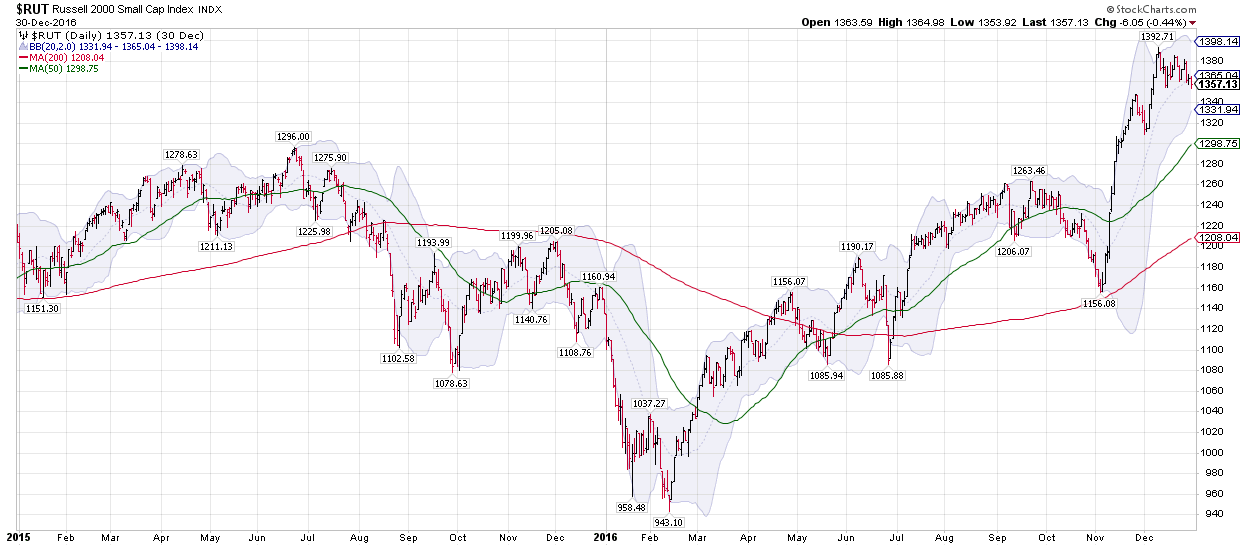
The stealth bear market saw many stocks go down a much larger percentage and the RUT fell from 1296 on 06/23/2015 all the way down to 943.10 on 02/11/2016.
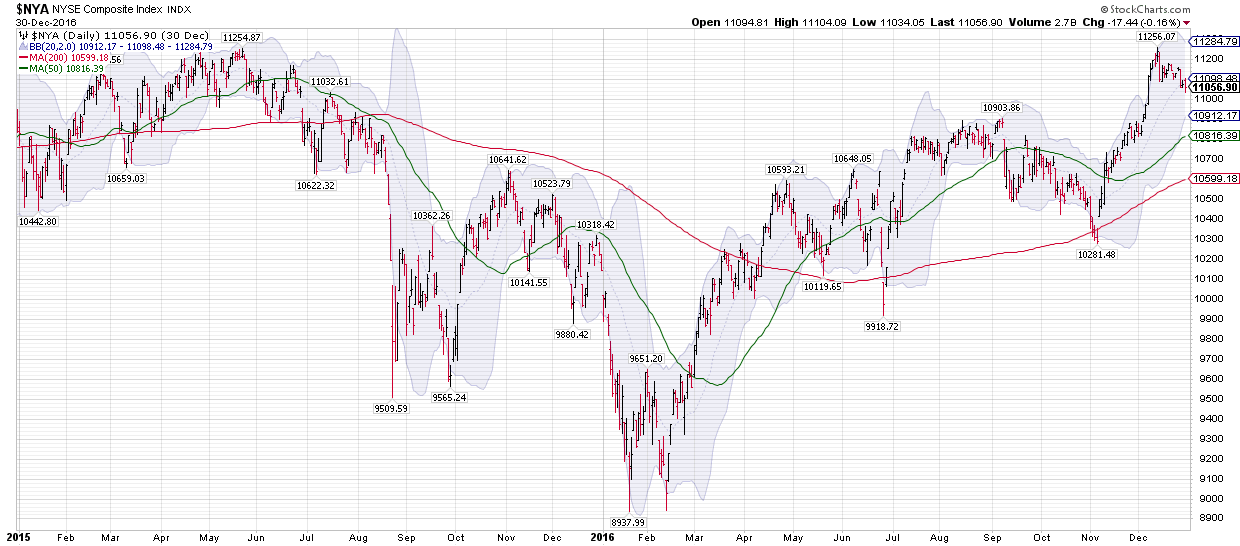
The NYSE fell from 11,254.87 on 05/21/2015 all the way to 8937.99 on 01/20/2016... many "nifty 50" stocks of the early teens of the 21st century experienced a much more severe mark down in price in this rotating 2 year bear market, obviously the energy sector stocks were decimated with huge percentage declines and a number of bankruptcies.
Here are a chart of the SPX from May of 1974 to May of 1975 which shows Oct 4th 1974 low

here is a chart of the NYSE stealth bear market from mid 2015 to Feb 2016
and the RUT from the same time period
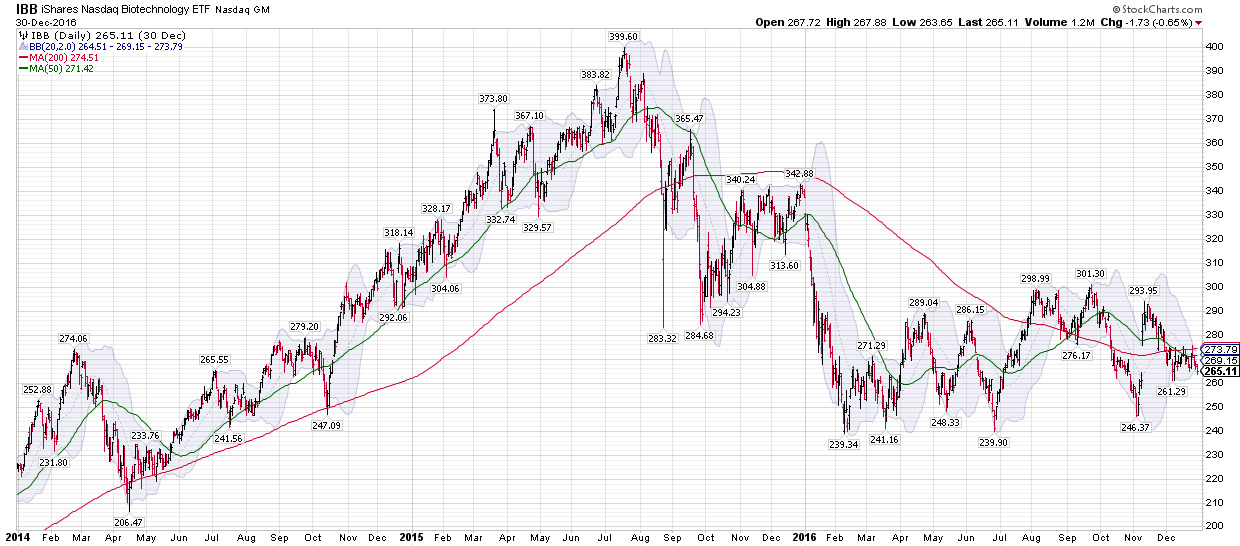
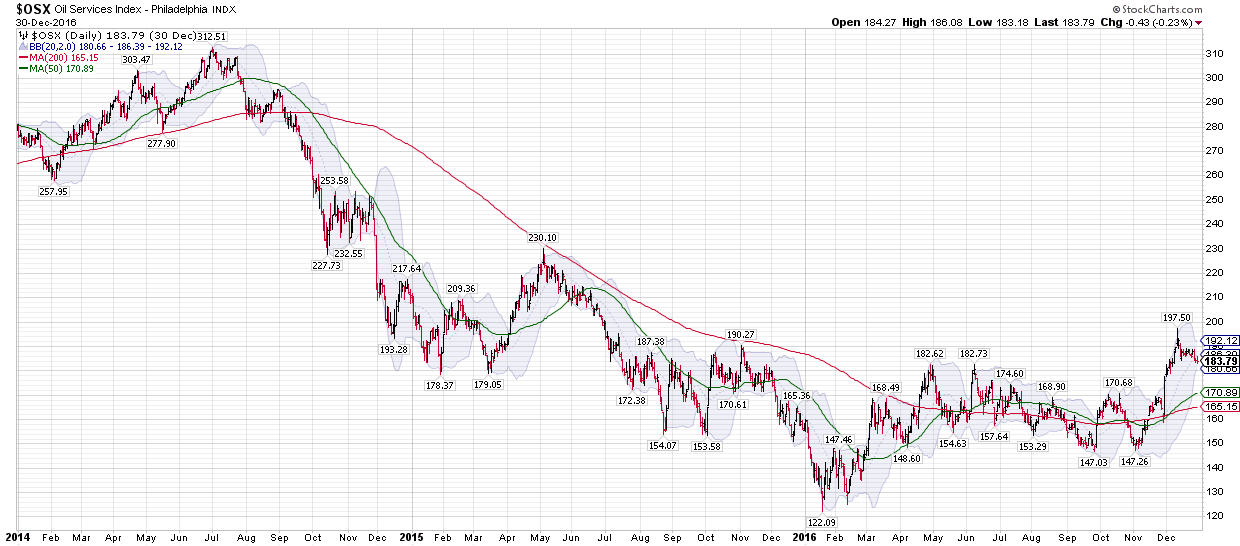
The 2 sectors that exemplify the extent of the bear market declines and Market capitalization destruction are the IBB biotech index and the OSX oil service sectors
the IBB from 2015 to 2017... you can see the extreme bull market that the biotech index experienced and then the sustained decline
The OSX oil service sector index was a real blood bath with price decline over 60%
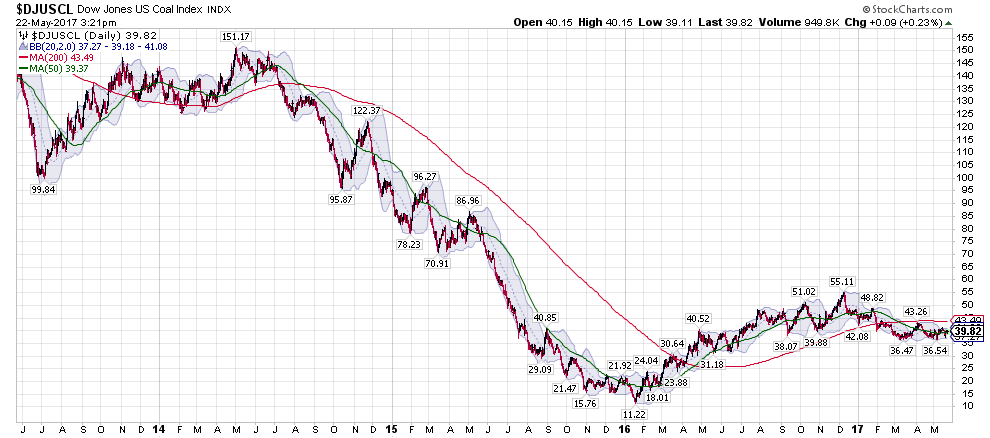
The coal subsector of the energy sector suffered the near equivalent of the bombing of Dresden in WWII.... or possible the dropping of the bomb on Hiroshima may even be a more appropriate equivalent of the total collapse of the coal sector.
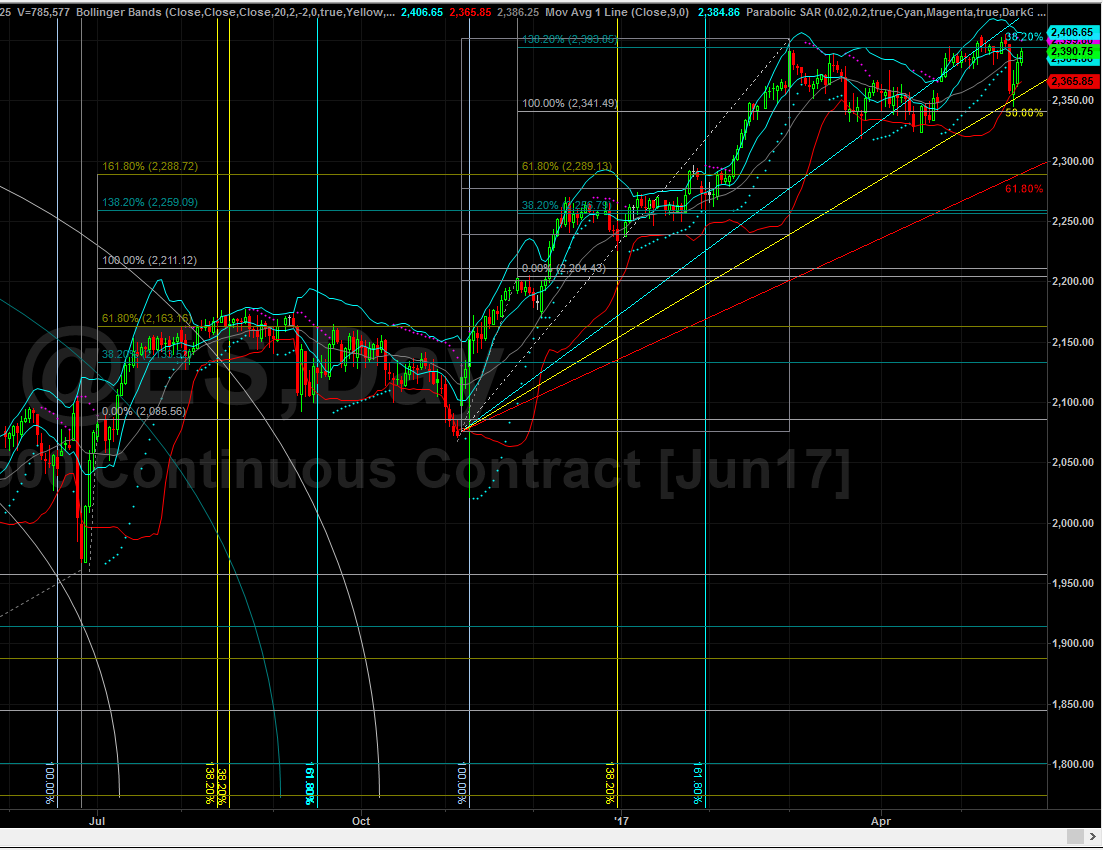
Here is an update SPX chart with the Fibonacci fractal projections
notice how the 1 day wonder decline in the SPX last week recieved supper support from the 100% price level of the fractal advance from the Nov 4th 2016 low at 2083.79 when the SPX hit it's 200 DMA and then advanced without a pullback into the 2277.53 price high on 12/13/16.
The SPX also received support on last weeks low from the 50% Fib Fan line from the very important 11/4/16 low at 2083.79
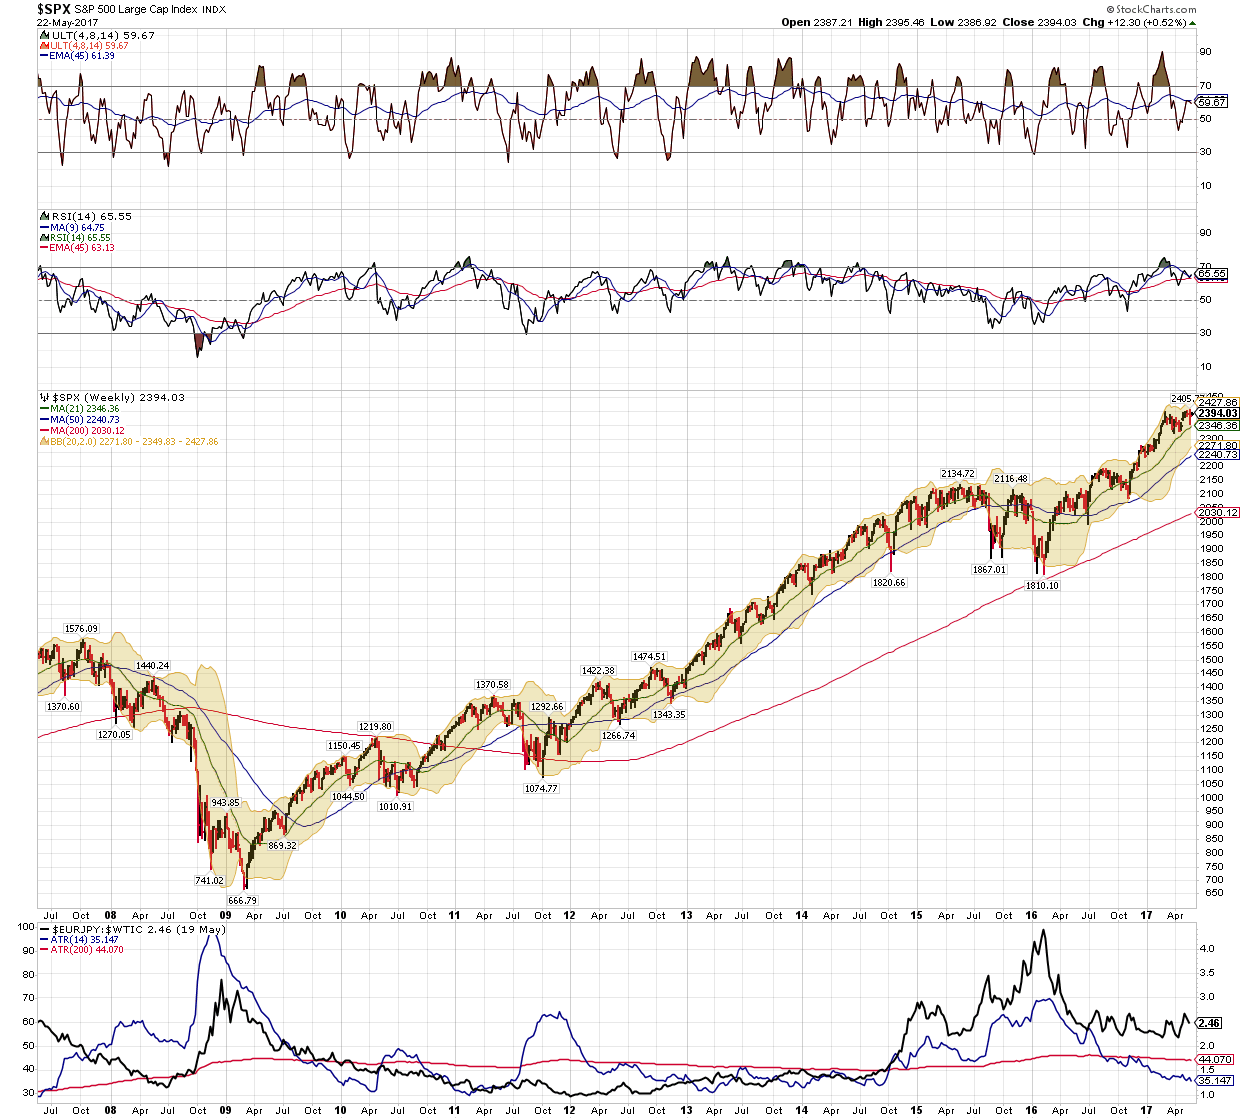
Here is the my Proprietary SPX JJP ATR cross of the Eur/JPY :$WTIC correlation chart. The methodology reinforces the case that we experienced a bear market and has a very good track record. I explained how the chart works in a post on 3/36/17 which I have reposted below the update chart, which has become even more bullish
---
this is my proprietary model that uses the EUR/JPY crossrate and then correlates it to WTIC.... so you have 4 of the deepest largest markets in the world..... the Eur/JPY "RIsk On Risk Off" then as a ratio of the single most important global commodity input crude.
I have shown this 2 or 3 times this past 15 months............ but it's just esoteric enough that it does not get traction in the layman and even the professional traders mind.
and it has had a very good record..... when the 13 week Average true range goes below the long term 200 week average true range with is calculated on the EUR/JPY Crossrate and then divided as a ratio of $WTIC.... what that calculation in KISS (KEEP it SIMPLE STUPID) is doing is showing when the relative volatility of 3 of the worlds biggest pricing components stabilizes.... it creates the necessary price stability in corporate planning models and in Global Macro Institutional Investor Models to expand risk exposure...that is long US equity exposure.

To Clarify the signals are generated when the Blue 14 period ATR goes below the long term 200 period Moving average.... and that generates a buy a the Average True Range of the EUR/JPY cross / by WTIC is coming down.. what is nice about this model is that you can have signals that are in effect for 2 years or so at a time.
JP |


