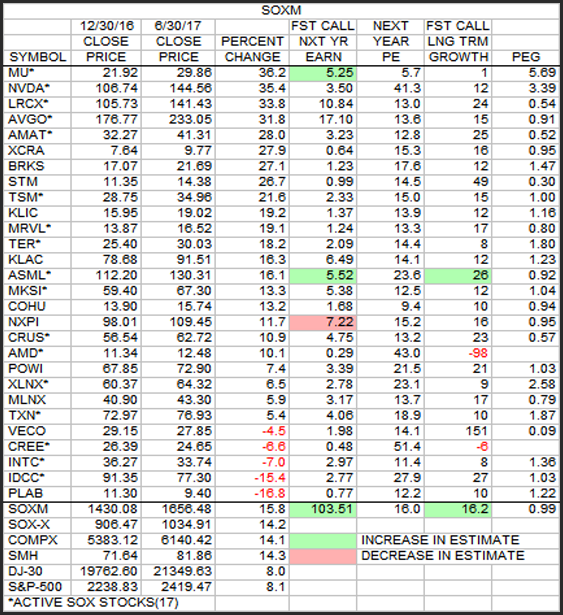
| | | OK readers, the following table is my favorite of the week, month, and year. All kinds of anomalies of which I will mention a few, but not all I am sure.
Keep in mind, this table shows the exact 6 months of trading this year. First of all, are there any readers that would have predicted that MU would be in the top spot in this sort for the first 6 months of the year. I know that I didn't. MU beat out NVDA which is in 2nd place. Look at the differences in PEs, MU(5.6), NVD(41.3).
Now let's look at Next Year earnings. All numbers here in this column have always referred to FYs. MU FY ends in Aug, NVDA ends in Jan. Therefor, MU is presently estimated at 5.25 from Aug 17 to Aug 18. NVDA is presently estimated at 3.50 from Jan 18 to Jan 19. The CY "gap" between the 2 numbers is 5 months.
LRCX is in 3rd place with a Next Year earnings estimate of 10.84 and the price closed at 141.43 giving a PE of 13.0. Its growth rate is estimated at 24 which gives a quite low PEG of 0.54. Nice numbers. INTC is 3rd from the bottom, down -7.0%. Maybe they are going out of business or just an "old" company with no pizzazz? AMAT and LRCX have nearly equal estimated PEs and growth rates.
 |
|


