Man Made Warming from Adjusting Data
Posted on4 Days Ago by Ron Clutz

Roger Andrews does a thorough job analyzing the effects of adjustments upon Surface Air Temperature (SAT) datasets. His article at Energy Matters is Adjusting Measurements to Match the Models – Part 1: Surface Air Temperatures. Excerpts of text and some images are below. The whole essay is informative and supports his conclusion:
euanmearns.com
In previous posts and comments I had said that adjustments had added only about 0.2°C of spurious warming to the global SAT record over the last 100 years or so – not enough to make much difference. But after further review it now appears that they may have added as much as 0.4°C.
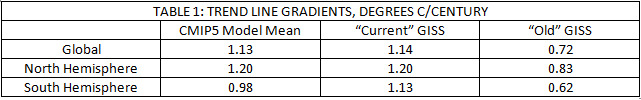
For example, these graphs show warming of the GISS dataset:
Figure 2: Comparison of “Old” and “Current” GISS meteorological station surface air temperature series, annual anomalies relative to 1950-1990 means
The current GISS series shows about 0.3°C more global warming than the old version, with about 0.2°C more warming in the Northern Hemisphere and about 0.5°C more in the Southern. The added warming trends are almost exactly linear except for the downturns after 2000, which I suspect (although can’t confirm) are a result of attempts to track the global warming “pause”. How did GISS generate all this extra straight-line warming? It did it by replacing the old unadjusted records with “homogeneity-adjusted” versions.
The homogenization operators used by others have had similar impacts, with Berkeley Earth Surface Temperature (BEST) being a case in point. Figure 3, which compares warming gradients measured at 86 South American stations before and after BEST’s homogeneity adjustments (from Reference 1) visually illustrates what a warming-biased operator does at larger scales. Before homogenization 58 of the 86 stations showed overall warming, 28 showed overall cooling and the average warming trend for all stations was 0.54°C/century. After homogenization all 86 stations show warming and the average warming trend increases to 1.09°C/century:

Figure 3: Warming vs. cooling at 86 South American stations before and after BEST homogeneity adjustments

The adjusted “current” GISS series match the global and Northern Hemisphere model trend line gradients almost exactly but overstate warming relative to the models in the Southern (although this has only a minor impact on the global mean because the Southern Hemisphere has a lot less land and therefore contributes less to the global mean than does the Northern). But the unadjusted “old” GISS series, which I independently verified with my own from-scratch reconstructions, consistently show much less warming than the models, confirming that the generally good model/observation match is entirely a result of the homogeneity adjustments applied to the raw SAT records.
Summary
In this post I have chosen to combine a large number of individual examples of “data being adjusted to match it to the theory” into one single example that blankets all of the surface air temperature records. The results indicate that warming-biased homogeneity adjustments have resulted in current published series overestimating the amount by which surface air temperatures over land have warmed since 1900 by about 0.4°C (Table 1), and that global surface air temperatures have increased by only about 0.7°C over this period, not by the ~1.1°C shown by the published SAT series.
Land, however, makes up only about 30% of the Earth’s surface. The subject of the next post will be sea surface temperatures in the oceans, which cover the remaining 70%. In it I will document more examples of measurement manipulation malfeasance, but with a twist. Stay tuned.
Footnote:
I have also looked into this issue by analyzing a set of US stations considered to have the highest CRN rating. The impact of adjustments was similarly evident and in the direction of warming the trends. See Temperature Data Review Project: My Submission

rclutz.wordpress.com |