New Paper: At Least 80% Of The Warming Over The Last Century Due To ‘Natural Phenomena’
By Kenneth Richard on 28. August 2017

“[E]ven if there had been no industrial revolution and burning of fossil fuels, there would have still been warming through the twentieth century – to at least 1980, and of almost 1°C.” – Abbot and Marohasy, 2017For those who ascribe to the position that humans are dangerously altering the Earth’s climate, it has become almost axiomatic to frame today’s climate changes as highly unusual, unprecedented, and falling well outside the range of natural variability. In this way, proponents of the dangerous anthropogenic global warming (DAGW) narrative can connect human activities (i.e., fossil fuel burning) to these “unnatural” climate changes.
The deepening problem for DAGW advocates, though, is there is nothing unusual, unprecedented, or remarkable about modern temperatures or rates of climatic change. Not only is there extensive scientific evidence available in the peer-reviewed scientific literature affirming today’s temperatures are no warmer than they have been for most of the last 10,000 years, but the paleoclimate evidence suggests centennial-scale fluctuations in the Earth’s surface (and subsurface ocean) temperatures can naturally reach rates and amplitudes that far exceed the modern values.
For example, Bova et al. (2016) found that ocean temperatures in the 0-1000 meter layer naturally (no human influence) rise and fall by more than 2°C in a span of 200 years, or 1°C per century. In contrast, the oceanographers found that the 0-1000 meter warming in the last 200 years of presumed anthropogenic influence has been so modest that it falls “ below the detection limit“.
Rosenthal et al., (2013) indicated that Pacific Ocean temperatures in the 0-700 meter layer have risen by just 0.25°C from 1600-1800 C.E. to 2000-2010, which is a rate of about 0.1°C per century, or one-tenth of the rate of warming (cooling) that has occurred without human influence during the Holocene.
New Paper: Natural Variability Explains Most Of the Modern WarmingIn a new paper published in GeoResJ, Abbot and Marohasy (2017) statistically document the extent to which regional or hemispheric temperatures have risen and fallen naturally over the past few thousand years. They then compare these documented natural amplitudes to the observed/measured record of centennial-scale temperature changes. They found that there is, at most, just a 0.2°C difference between the naturally-occurring temperature change amplitudes (no human influence) and the modern era’s temperature changes (with assumed human influence). So if there has been a 1°C increase in global temperature since the 1800s, at most 0.2°C could have possibly fallen outside the range of natural variation and thus ascribed to human activity. The rest (0.8°C and up) of the contribution would therefore be of natural origin. So, as the authors conclude, “the increase in temperature over the last 100 years can be largely attributed to natural phenomena.”
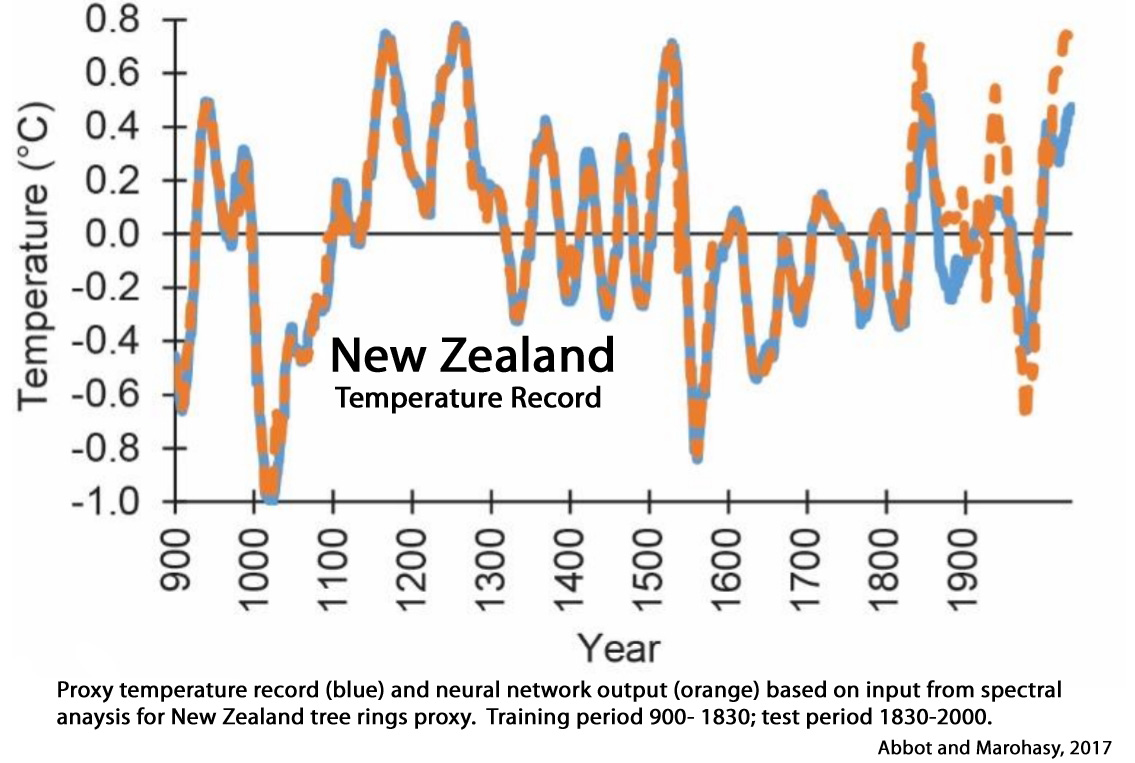
Abbot and Marohasy, 2017The proxy measurements suggest New Zealand’s climate has fluctuated within a band of approximately 2°C since at least 900 AD, as shown in Figure 2. The warming of nearly 1°C since 1940 falls within this band. The discrepancy between the orange and blue lines in recent decades as shown in Figure 3, suggests that the anthropogenic contribution to this warming could be in the order of approximately 0.2°C. [80% of the warming since 1940 may be due natural factors].
The largest deviation between the ANN [artificial neural network, which identifies amplitudes of natural variability in the paleoclimate record] Earth projections and measured temperatures for six geographically distinct regions was approximately 0.2?°C, and from this an Equilibrium Climate Sensitivity (ECS) of approximately 0.6?°C [for a doubling of CO2 from 280 ppm to 560 ppm plus feedbacks] was estimated. This is considerably less than estimates from the General Circulation Models (GCMs) used by the Intergovernmental Panel on Climate Change (IPCC), and similar to estimates from spectroscopic methods.
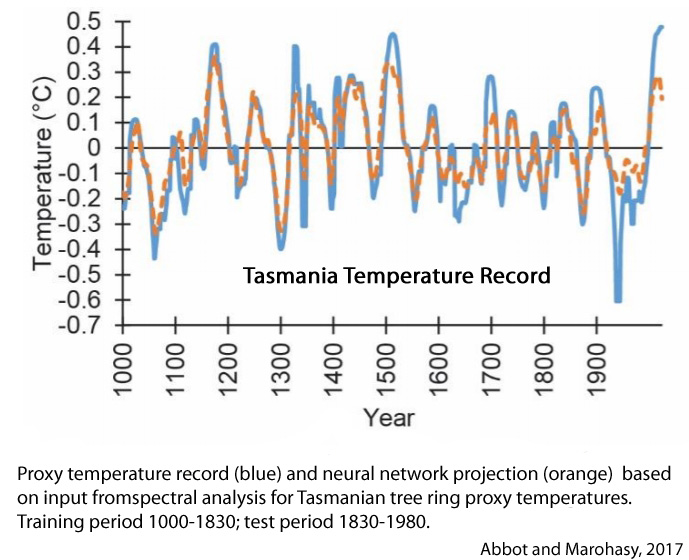
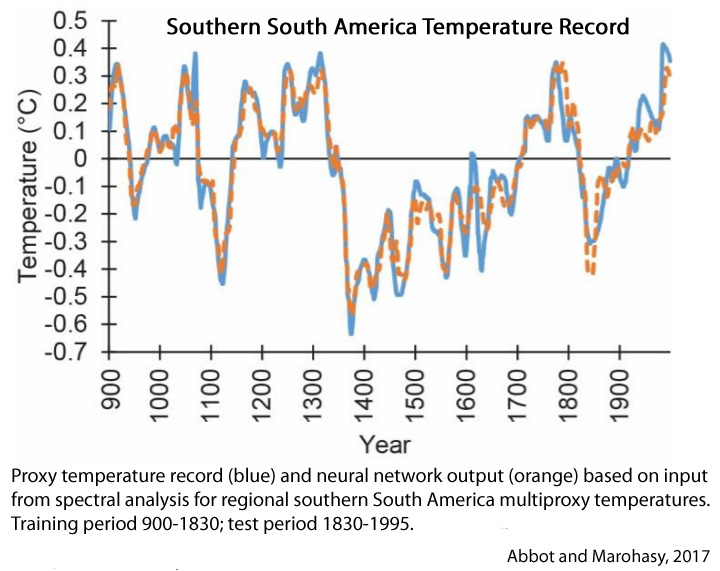
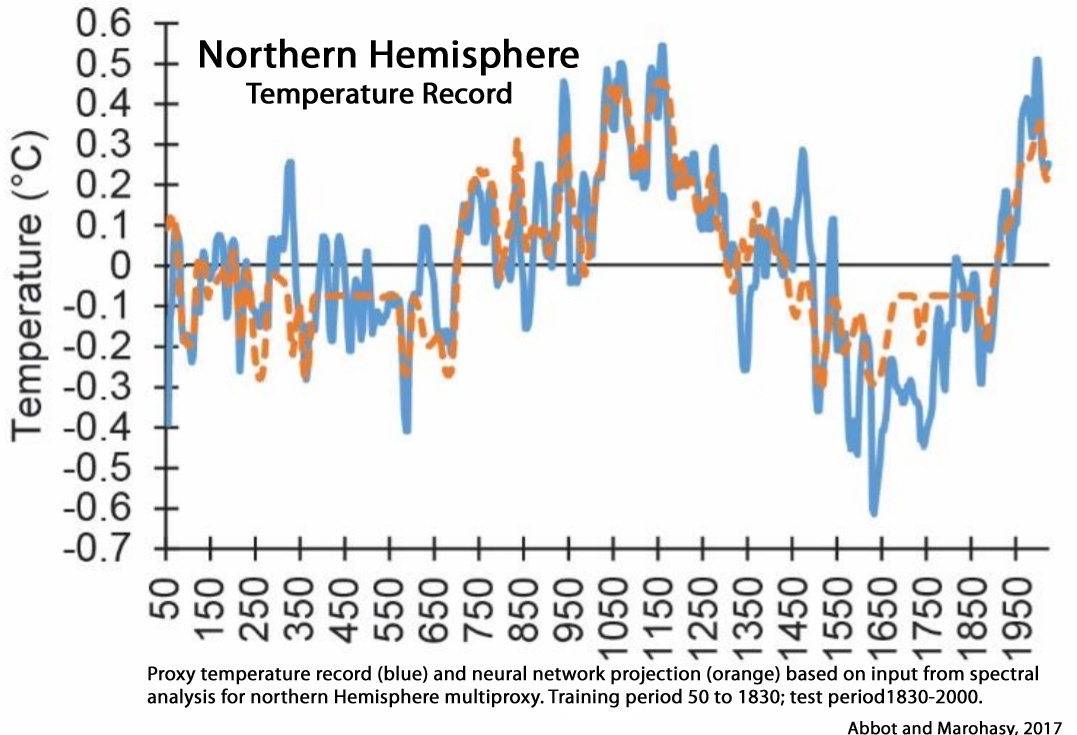
To summarize, Figures 3, 5, 7, 9, 11 and 13 [New Zealand, Southern South America, Tasmania, Canadian Rockies, Sweden and the Northern Hemisphere] indicate that the period from 1880 to the end of the proxy records shows general correspondence between the projections generated by ANN output (which is based on input using extrapolation of natural oscillations from the pre-industrial era), and the actual proxy temperature measurements. Importantly, an upward trend is generally apparent for both the proxy measurements and the ANN model projection for the 20th century. This would suggest that the increase in temperature over the last 100 years can be largely attributed to natural phenomena.
( press release)
[A]fter applying the latest big data technique to six 2,000 year-long proxy-temperature series we cannot confirm that recent warming is anything but natural – what might have occurred anyway, even if there was no industrial revolution.
[E]ven if there had been no industrial revolution and burning of fossil fuels, there would have still been warming through the twentieth century – to at least 1980, and of almost 1°C.
What Are These ‘Natural Phenomena’ Driving Temperature Fluctuations? Abbot and Marohasy, 2017 (continued)There is an extensive literature examining the occurrence of periodic cycles within proxy temperature reconstructions, through application of spectral analysis (Raspopov et al., 2008; Swingedouw et al., 2011; Galloway et al., 2013). Many of these studies also discuss possible relationships between these cyclic patterns in temperature profiles and natural phenomena that may affect causation, particularly those associated with solar cycles (Luckman, 2005; Nordeman et al., 2005; Wilson et al., 2007; Hunt, 2006; Beer et al., 2000; Scafetta, 2013; Scafetta 2016; Dergachev and Raspopov, 2010). For example:
(a) [I]n the southern hemisphere, Nordemann et al. (2005) undertook spectral analysis using tree ring data from Brazil and Chile, providing evidence for associations with solar cycles, particularly the Suess (~200 year), Gleissberg (~90 years), Hale (~ 22 years) and Schwabe (11 years) cycles.
(b) Rigozoa et al. (2007) examined tree ring widths in Chile, and found an association with solar activity with 11 and 80 year periodicities.
(c) In the northern hemisphere, Raspopov et al. (2008) performed spectral analysis of long-term dendrochronological data from Central Asia and demonstrated an approximate 200-year climatic periodicity, showing a high correlation with solar periodicity for the de Vries period (~210 years).
(d) Ogurtsov et al. (2013) reported spectral analysis of tree periodicity and discussed the association with the modulation of regional climate in Northern Fennoscandia by the Gleissberg solar cycle (~90 years).
(e) Moffa-Sánchez et al. (2014) examined marine sediments for isotopic signals in the shells of the planktonic foraminifera over the past 1000 years. Spectral analysis showed a 200-year periodicity, identified with de Vries solar cycle (~210 years).
(f) Galloway et al. (2013) generated a late Holocene temperature record based on diatoms from a sediment obtained from British Columbia, Canada. Spectral analysis shows significant periodicities at 42–60, 70–89, 241 243, and 380 years, and inferred relationships to sunspot number variation.
(g) Tan and Liu (2003) produced a 2650-year temperature reconstruction from annual layers of a stalagmite from China, with spectral analysis indicating significant periodicities at 206 and 325 years.
(h) Cyclic variations have also been associated with large-scale internal climate oscillatory modes (Bengtsson and Schwartz, 2013) that may themselves in turn be influenced by solar activity(Zhang et al., 2014, Yamin et al., 2016; Li et al., 2013; Trouet and Taylor, 2010; Tei et al., 2010). For example, Wilson et al. (2007) examined tree ring widths to enable a reconstruction over 1,300 years for the Gulf of Alaska: identifying oscillatory modes at 90, 38, 24, 50.4 and 18.7 years related to changes in sea surface temperature pattern. In addition to the decadal and centennial cyclic periodicities referred to above, there is evidence of cycles on millennial time scales, for example the Bond and DansgaardOeschger (DO) cycles (Mullins et al., 2011; Yi et al., 2016).
Supporting Evidence: Large (1-2°C/100 Years) Natural Climate Fluctuations Moore et al., 2001Summer temperatures at Donard Lake [Canadian Arctic] over the past 1250 yrs averaged 2.9 °C. At the beginning of the 13th century, Donard Lake experienced one of the largest climatic transitions in over a millennium. Average summer temperatures rose rapidly by nearly 2 °C from 1195–1220 AD[+0.80 C per decade], ending in the warmest decade in the record (~4.3 °C).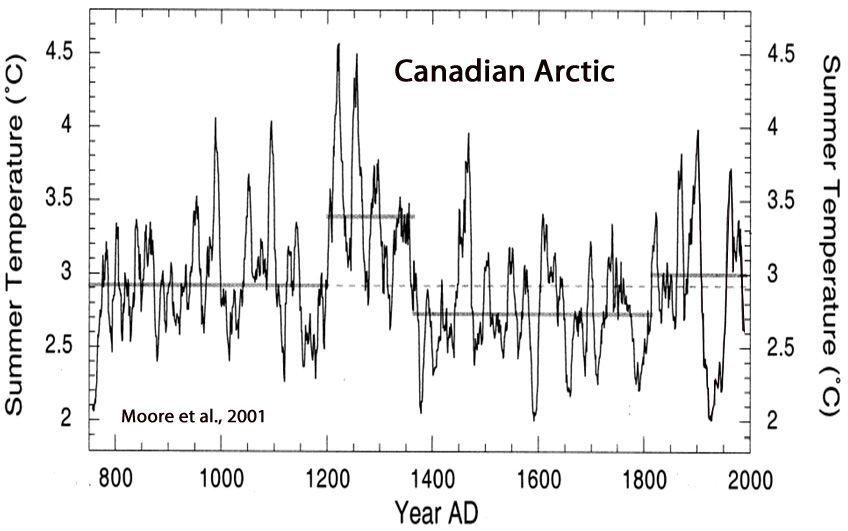
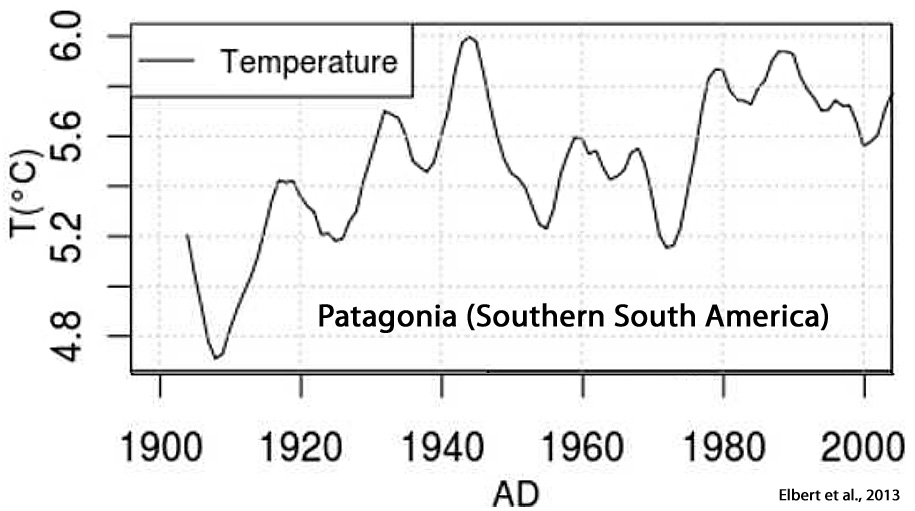
Elbert et al., 2013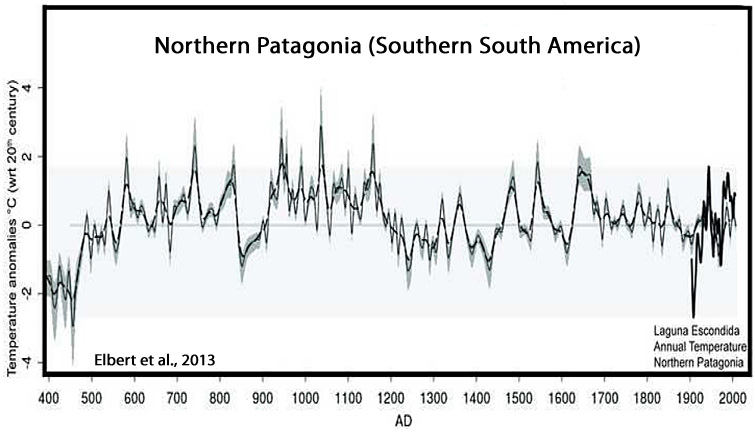
Aagaard-Sørensen, 2014The sSSTMg/Ca [sea surface temperature] values [Fram Strait, Arctic Ocean] increase and vary between 2.1°C and 5.8°C [+/-3.7°C] from ~2.7 kyr BP [2,700 years ago] to the present. Gennaretti et al., 2014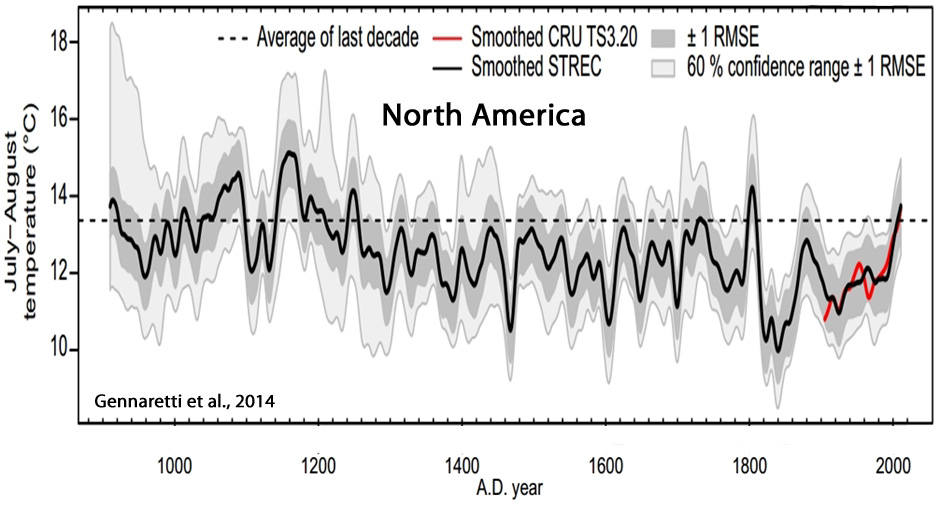
Thapa et al., 2015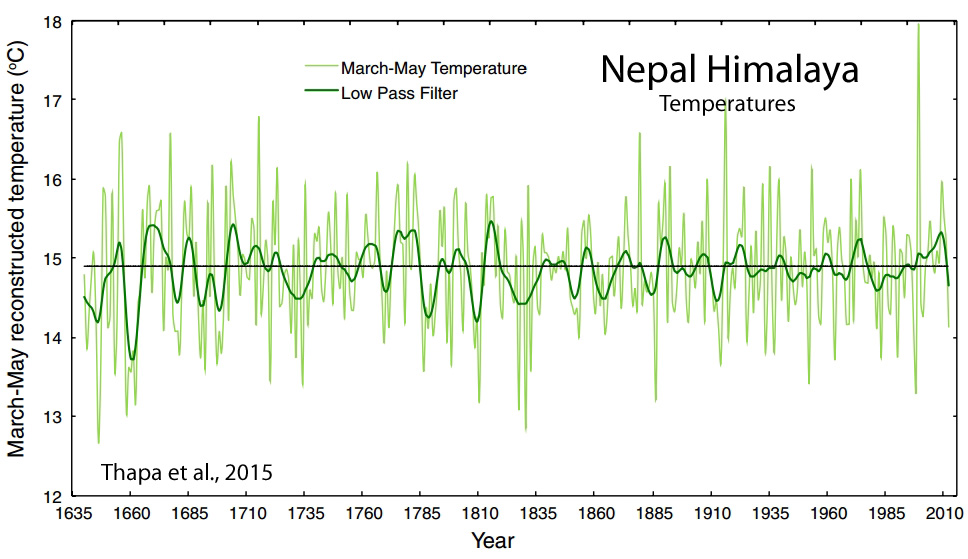
Rydval et al., 2017[T]he recent summer-time warming in Scotland is likely not unique when compared to multi-decadal warm periods observed in the 1300s, 1500s, and 1730s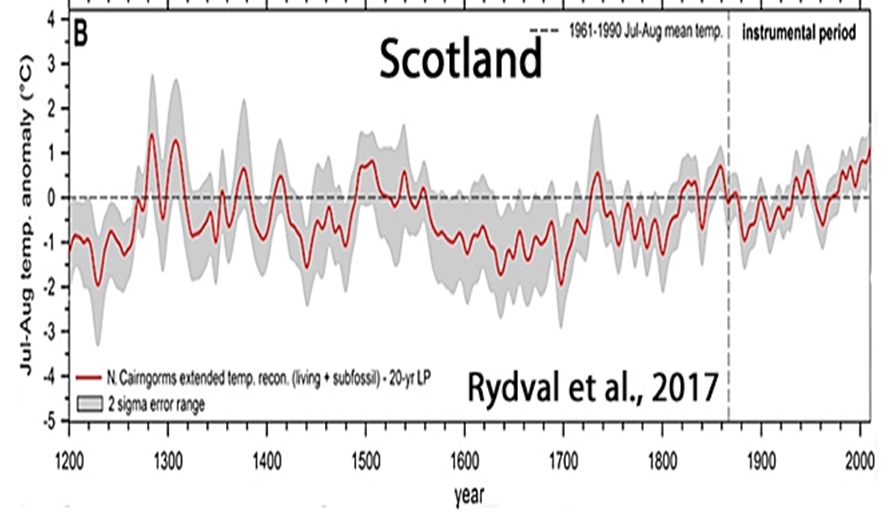
Tamura et al., 2016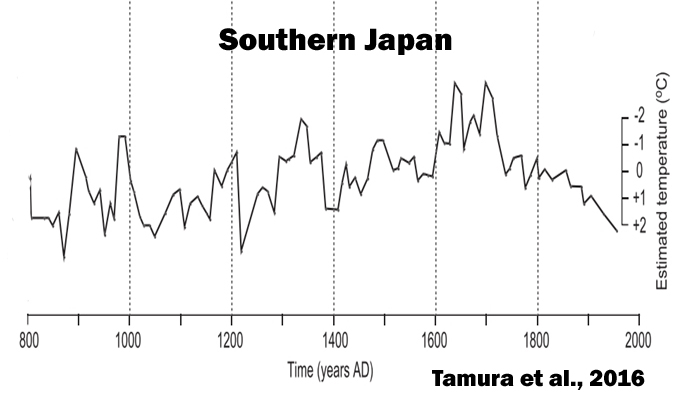  Jansen et al., 2016We suggest that deviations in ELA fluctuations between Scandinavian maritime and continental glaciers around 7150, 6560, 6000, 5150, 3200 and 2200 cal. yr BP reflect the different response of continental and maritime glaciers to drops in total solar irradiance (TSI). Jansen et al., 2016We suggest that deviations in ELA fluctuations between Scandinavian maritime and continental glaciers around 7150, 6560, 6000, 5150, 3200 and 2200 cal. yr BP reflect the different response of continental and maritime glaciers to drops in total solar irradiance (TSI).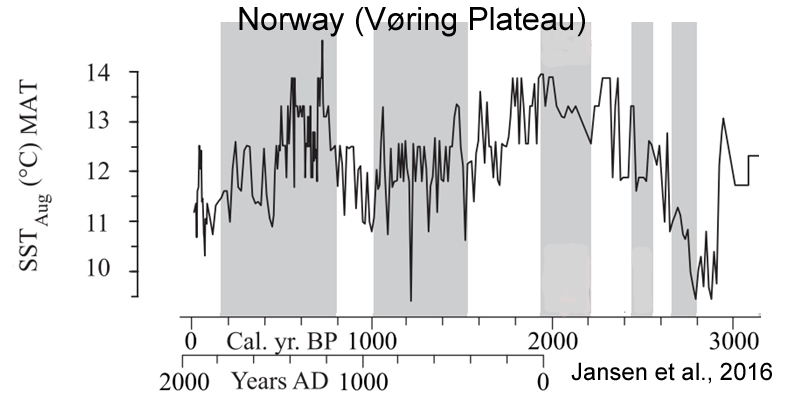
Sun et al., 2017Our findings are generally consistent with other records from the ISM [Indian Summer Monsoon] region, and suggest that the monsoon intensity is primarily controlled by solar irradiance on a centennial time scale. This external forcing may have been amplified by cooling events in the North Atlantic and by ENSO activity in the eastern tropical Pacific, which shifted the ITCZ further southwards.
Chang et al., 2017The chironomid-based record from Heihai Lake shows a summer temperature fluctuation within 2.4°C in the last c. 5000 years from the south-east margin of the QTP [Qinghai–Tibetan Plateau]. … The summer temperature changes in this region respond primarily to the variation in the Asian Summer Monsoon. The variability of solar activity is likely an important driver of summer temperatures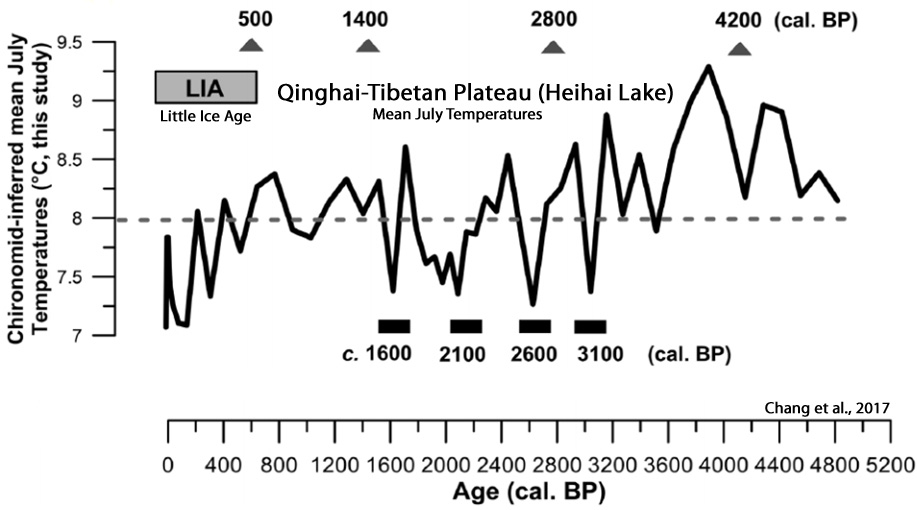
http://notrickszone.com/#sthash.03JtRSl8.dpbs |
|


