Some points about extreme weather events are trending up. Others are trending down. Others appear to be trending up only because we are more away of them. Others have no particular trend.
You want evidence of climate change? Well you can look to evidence of higher temperatures and receding glaciers (which started before man did much to contribute to change, but human activity is a factor). Extreme weather events - not so much. A particular hurricane, not at all.
-------------------------------------------------------------------
Normalized Tornado Damage in the United States: 1950-2011
in press, Environmental Hazards
Kevin M. Simmons, Daniel Sutter and Roger Pielke, Jr.
Abstract
In 2011, thunderstorms in the United States resulted in 550 deaths from tornadoes and more than $28 billion in property damage, according to data from the US National Oceanic and Atmospheric Administration, with the vast majority of economic losses resulting from tornadoes. This paper normalizes U.S. tornado damage from 1950 to 2011 using several methods. A normalization provides an estimate of the damage that would occur if past events occurred under a common base year's societal conditions. We normalize for changes in inflation and wealth at the national level and changes in population, income and housing units at the county level. Under several methods, there has been a sharp decline in tornado damage. This decline corresponds with a decline in the reported frequency of the most intense (and thus most damaging) tornadoes since 1950. However, quantification of trends in tornado incidence is made difficult due to discontinuities in the reporting of events over time. The normalized damage results are suggestive that some part of this decline may reflect actual changes in tornado incidence, beyond changes in reporting practices. In historical context 2011 stand out as one of the most damaging years of the past 61 and provide an indication that maximum damage levels have potential to increase should societal change lead to increasing exposure of wealth and property.Why is this paper important?
This is the first paper to comprehensively "normalize" historical economic losses from US tornadoes. Normalization methods have been widely applied to phenomena around the would including US hurricanes and Australian bushfires. We use damage data collected by the National Oceanic and Atmospheric Administration, a US government agency which houses the Storm Prediction Center. We use three methods to adjust the data to a common base year (2011).The analysis allows us to say something about damage over time, in this case since 1950. The Figure below shows normalized damage 1950-2011 for one of our adjustment methods.

What do you find?
- Overall we find a decrease in damages since 1950.
- Even so 2011 was one of the 3 most costly years in our dataset.
- Our dataset includes 56,457 tornadoes, of which 33,746 caused some recorded damage.
- Since 1950, in round numbers, tornadoes resulted in about half the normalized damage as did hurricanes and twice that of earthquakes
- The strongest two categories of tornadoes (called EF4 and EF5) represent about 1% of all reported events but have caused almost 45% of all normalized damage.
- The most damage per sqaure mile from1950-2011 has occurred in Massachusetts and Connecticut.
- The most damage overall from 1950-2011 has occurred in Texas and Alabama.
- During the calendar year 80% of damage occurs January-June.
- The most damaging months are April (31%), May (20%) and June (16%).
What about long-term trends in damage and tornado incidence?
Here is what we say in the paper:
"The normalized results are also suggestive that the long-term decrease in reported tornado incidence may also have a component related to actual, secular changes in tornado incidence beyond reporting changes. To emphasize, we do not reach any conclusion here that stronger that “suggestive” and recommend that this possibility be subject to further research, which goes beyond the scope of this study.
On climate time scales there is no indication of increasing incidence of tornadoes, and the increases documented over the short (sub-climate) period 2000-2011 are strongly influenced by the large number of events documented in 2011. However, the decreased frequency of high damage events in recent decades as compared to previous decades is a notable feature in the time series and provides strong counter-evidence to claims found in the scientific literature that the atmospheric environment that spawns tornadoes has intensified leading to more intense events on climate time scales (e.g., Trenberth, 2012). Such claims are commonly found in the popular media and also in the insurance/reinsurance sector where they influence public opinion and decision making in business and government. The most recent review by the IPCC found no basis for claiming an increase (or decrease) in tornado incidence or intensity (IPCC, 2012)."
rogerpielkejr.blogspot.com
Global Warming in a Few Slides Dr. John Christy participated in a conference on global warming last month, and presented some power points that make several points with respect to the ongoing climate debate. All of these observations will be familiar to Power Line readers, but Dr. Christy’s visuals are effective. You can view the power point slides here, and the accompanying text here. The following are some of Christy’s slides.
Tornadoes are not becoming more frequent. On the contrary:


Snow cover in the northern hemisphere, where the most plausible claims of warming have been made, is not diminishing:

In the U.S., the climate is getting neither wetter nor dryer:

High temperature records are not being set with unusual frequency:

The climate models that are the only basis for warming alarmism are refuted by observation, and therefore are simply wrong:

And, finally, even if the U.S. were to adopt unrealistically harsh measures to restrict carbon output by impoverishing Americans, the effect on the Earth’s climate–assuming the models are right–would be close to zero:

More Weather Deaths? Wanna Bet?
Contrary to what many environmentalists would have us believe, Americans are increasingly less likely to be killed by severe weather.
By DONALD J. BOUDREAUX
Writing recently in the Washington Post, environmental guru Bill McKibben asserted that the number and severity of recent weather events, such as the tornado in Joplin, Mo., are too great not to be the result of fossil-fuel induced climate change. He suggested that government's failure to reduce emissions of greenhouse gases will result in more violent weather and weather-related deaths in the future.
And pointing to the tragedy in Joplin, Mr. McKibben summarily dismissed the idea that, if climate change really is occurring, human beings can successfully adapt to it.
There's one problem with this global-warming chicken little-ism. It has little to do with reality. National Weather Service data on weather-related fatalities since 1940 show that the risks of Americans being killed by violent weather have fallen significantly over the past 70 years.
The annual number of deaths caused by tornadoes, floods and hurricanes, of course, varies. For example, the number of persons killed by these weather events in 1972 was 703 while the number killed in 1988 was 72. But amid this variance is a clear trend: The number of weather-related fatalities, especially since 1980, has dropped dramatically.
For the 30-year span of 1980-2009, the average annual number of Americans killed by tornadoes, floods and hurricanes was 194—fully one-third fewer deaths each year than during the 1940-1979 period. The average annual number of deaths for the years 1980-2009 falls even further, to 160 from 194, if we exclude the deaths attributed to Hurricane Katrina, most of which were caused by a levee that breached on the day after the storm struck land.
This decline in the absolute number of deaths caused by tornadoes, floods and hurricanes is even more impressive considering that the population of the United States more than doubled over these years—to 308 million in 2010 from 132 million in 1940.
Contrary to what many environmentalists would have us believe, Americans are increasingly less likely to be killed by severe weather. Moreover, because of modern industrial and technological advances—radar, stronger yet lighter building materials, more reliable electronic warning devices, and longer-lasting packaged foods—we are better protected from nature's fury today than at any other time in human history. We do adapt.
Of course, this happy trend might not continue. Maybe the allegedly devastating consequences of our "addiction" to fossil fuels, and the rapid economic growth these fuels make possible, will soon catch up with us. Maybe the future will be more deadly.
I reject this pessimism. I do so because economics and history teach that human beings in market economies have proven remarkably creative and resourceful in overcoming challenges. And there's no reason to think that this creativity and resourcefulness will fail us in the face of climate change.
Since 1950 there have been 57 confirmed F5 tornadoes, with winds between 261–318 miles per hour, in the U.S. Of those, five struck in 1953; six in 1974. So far this year there have been four F5 tornadoes in the U.S., including the devastating storm that killed more than 130 people in Joplin on May 22. F5 tornadoes are massive, terrifying and deadly. But they generally touch down in unpopulated areas, thus going unnoticed. The tragedy of Joplin and other tornadoes this year is that they touched down in populated areas, causing great loss of life. Yet if these storms had struck even 20 years ago there would have been far more deaths.
So confident am I that the number of deaths from violent storms will continue to decline that I challenge Mr. McKibben—or Al Gore, Paul Krugman, or any other climate-change doomsayer—to put his wealth where his words are. I'll bet $10,000 that the average annual number of Americans killed by tornadoes, floods and hurricanes will fall over the next 20 years. Specifically, I'll bet that the average annual number of Americans killed by these violent weather events from 2011 through 2030 will be lower than it was from 1991 through 2010.
If environmentalists really are convinced that climate change inevitably makes life on Earth more lethal, this bet for them is a no-brainer. They can position themselves to earn a cool 10 grand while demonstrating to a still-skeptical American public the seriousness of their convictions.
But if no one accepts my bet, what would that fact say about how seriously Americans should treat climate-change doomsaying?
Do I have any takers?
Mr. Boudreaux is professor of economics at George Mason University and a senior fellow at the Mercatus Center.
online.wsj.com
healthblog.ncpa.org
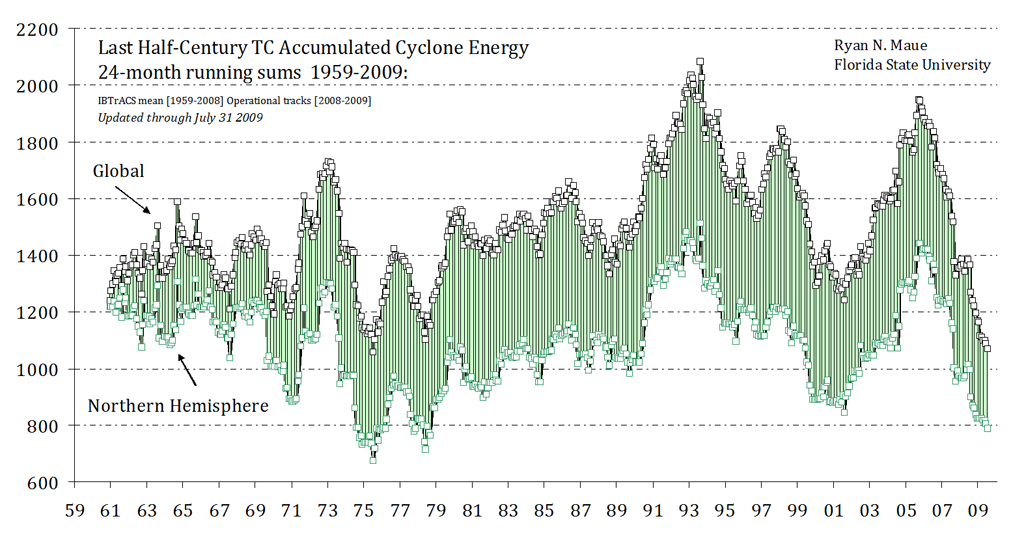
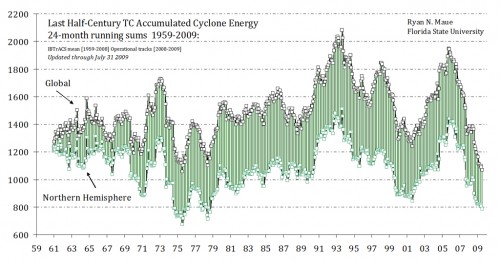
Postscript #1: By the way, hurricane counts are a horrible way to measure hurricane activity (hurricane landfalls are even worse). The size and strength and duration of hurricanes are also important. Researchers attempt to factor these all together into a measure of accumulated cyclone energy. This metric of world hurricanes and cyclones has actually be falling the last several years.
powerlineblog.com
------------
The most intense hurricane to hit the US (lowest central pressure on initial US landfall) was the 1935 Labor Day hurricane. Out of the top 10, 1 (Katrina) was in the 21st century and only 2 (Katrina and Andrew) were post 1990. 4 were before 1930, despite the fact that in the earlier days of the country the pressure wouldn't have been measured so they wouldn't be on the list. While barometers existed as far back as the 1600s a practical aneroid recording baromiter wasn't invented until 1844. I don't know when barometers were deployed across the US to a great enough extent to catch a strong majority of hurricanes but I'd guess it would be post Civil War, maybe late 19th century.
From 1880 onwards the number of hurricanes in the top 10 in US history for each decades (decade not listed if zero)
1880's - 1
1910's - 1
1920's - 2
1930's - 1
1960's - 3
1990's - 1
2000's - 1
There where more top ten hurricanes in the 17 years from 1919 to 1935 and also more in the 9 years from 1961 to 1969 then there has been in the 46 years from 1970 to 2015. *
Most intense landfalling U.S. hurricanes
Intensity is measured solely by central pressure Rank Hurricane Season Landfall pressurefrom en.wikipedia.org |