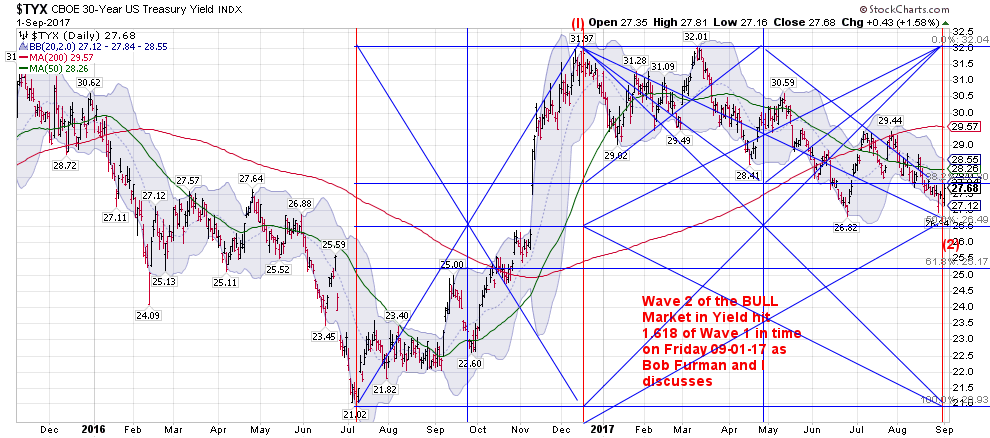
| | | SO THE LOW IN THE 30YEAR INTEREST RATE FOR 2017 OCCURRED WITHIN 4 DAYS OF OUR IDEALIZED LOW ON SEPT 2ND. IT ILLUSTRATES THE KEY POINT THAT CALENDAR TIME IS MORE IMPORTANT THAN MARKET DAYS WHEN WORKING WITH TIME CYCLES.
My Time projection work was partly done using the retracement of wave 2 being 1.618 of the time of
the impulse wave 1.... However i used my Fibonacci ratio compass on the market days on the chart, i noticed a difference of several days when I used the time in days of the wave 1 off the July 8th 2016 low and the Dec 16th High. Now remember that this is the 30 year bond the Very long end of the curve, and it acted differently than the 10 year note. As the 30 year yield had a slightly higher high on March 10. Very different from the 10 year note behaviour.
Of course the 36 year cycle low was put into place on July 8th 2016........ we have already embarked on a multiyear bear market in bonds and a multi year rise in interest rates. Which makes sense with all of the asset bubbles that have been going on with the 1% ers..... who are very out of favor with the very angry DJT voters, the Bernie Sanders voters, the Elizabeth Warren and Barney Frank parts of the Democratic
Party and that's a cumulative 70% of the population.... at least.
The 36 year cycle in the bond bull market that began on Oct 9th 1981 at 14.59% yield on the 30 year bond
Ended on July 8th 2016. The Between July 5th and 8th The BOJ, The ECB and the SNB pulled the plug on
driving the long end of the Major Global Sovereign Bonds into Lower and Lower Negative Yield world. The
Fed was also a Master architect of the end of the $16 Trillion dollar Series of Quantivative Easings and
endless balance sheet expansions of the Central Banks balance sheets, as we had asset bubbles in
global Real Estate in Hong kong, New York, London, Paris, Miami, Vancover etc, as well as asset Bubbles in the High end of the Fine Art Market and other markets of the 1% ers.
And Now The mounting asset bubble in the 876 and growing Cryptocurrency market is being viewed with a jaundiced eye and extreme prejudice by the major global Central Banks as no way on earth are they going to let everyone on the planet get into their central banking business of creating digital money out of thin air.
The solution...... get interest rates significantly higher so that Bitcoin, Bitcash, ethereum,, Ripple, LiteCoin, Monero, Ethereum Classic, Dash, MaidSafeCoin, Augar, and NEM
those were the top 10 Cryptocurrencies by market capitalization in January of 2017
atozforex.com
which do not have a yield become less attractive stores of value when we get interest rates on the 30 year up to 4.46% which will be 178 basis point up in a 1.618 move off of the wave 2 low made this week, added to the 1.10 basis point advance from 2.10 on 7/8/16 up to the wave 1 high of 3.197 made on Dec 16th of
2016. This will normalize interest rate and enable Major Pension funds, endowment funds, Insurance companies , as well as savers and folks over 50 who have had the blood squeezed out of them by not being able to get any yield in a Non risky asset class.
When the yield on the 10 year and 30 year note go higher, it leads to a multiple contraction as the earnings
yield and dividend yield on stocks becomes less attractive and equities are riskier assets.
This Chart was posted on Sept 2nd, and due to the extreme exegencies of Hurricane Harvey and the soon to be emerging Hurricane Irma, coupled with some ECB machinations..... we also briefly got down to almost 2% in yield overnight during the weekend of Hurricane Irma.
have moved like grease lightening of of that 2.00% area briefly touched overnight and in the overseas markets and vaulted back to 2.35% with such impulse power... accompanied by upside gaps that I doubt we see 2.13% again this year, which is a key level from several FIbonacci cluster, GANN price zones as well
as it's a critical level so that the yield curve does not start to defacto invert.regarding a number of large derivative interest rate swaps geared to that level.
------------------------------------------------------------------------------------------------------------------------------------
This is a VERY PROFOUND CHART...... In has Implications for Equity Prices, Commodity prices,
Interest Rate directions and also will be impacting the Major Currencies.
--------------------------------------------------------------- |
|


