| | | THE low for the US 30 year interest rate OCCURRED WITHIN 4 DAYS of our idealized low on . It Illustrates the key point that calendar days are often more important than market days when working with time cycles.
Also time cycles, besides have right hand translation in a bull market (where prices advance for the first 2/3 or so of the time cycle and then decline into the cycle low) and leftward translation in bear markets. In bear markets price tend to have a rally off of the cycle low which is shorter lived and then prices resume the downtrend into the next cycle low from 55 to 75 % of the cycle. There are several theories as to the causation of time cycles and there are multiple cycles at work in a market at any point in time. They wax and wane in their power and importance, and when several time cycles cluster together they can produce a
more powerful significant low, as well as provide the upward energy when several of them cluster in their
up phase.
My Time projection work was partly done using the retracement of wave 2 being 1.618 of the time of
the impulse wave 1.... However i used my Fibonacci ratio compass on the market days on the chart, I noticed a difference of several days when I used the time in days of the wave 1 off the July 8th 2016 low and the Dec 16th High. Now remember that this is the 30 year bond the Very long end of the curve, and it acted differently than the 10 year note. As the 30 year yield had a slightly higher high on March 10. Very different from the 10 year note behavior.
Of course the 36 year cycle low was put into place on July 8th 2016........ we have already embarked on a multiyear bear market in bonds and a multi year rise in interest rates. Which makes sense with all of the asset bubbles that have been going on with the 1% ers..... who are very out of favor with the very angry DJT voters, the Bernie Sanders voters, the Elizabeth Warren and Barney Frank parts of the Democratic
Party and that's a cumulative 70% of the population.... at least.
The 36 year cycle in the bond bull market that began on Oct 9th 1981 at 14.59% yield on the 30 year bond
Ended on July 8th 2016. The Between July 5th and 8th The BOJ, The ECB and the SNB pulled the plug on
driving the long end of the Major Global Sovereign Bonds into Lower and Lower Negative Yield world. The
Fed was also a Master architect of the end of the $16 Trillion dollar Series of Quantitative Easings and
endless balance sheet expansions of the Central Banks balance sheets, as we had asset bubbles in
global Real Estate in Hong kong, New York, London, Paris, Miami, Vancover etc, as well as asset Bubbles in the High end of the Fine Art Market and other markets of the 1% ers.
And Now The mounting asset bubble in the 876 and growing Cryptocurrency market is being viewed with a jaundiced eye and extreme prejudice by the major global Central Banks as no way on earth are they going to let everyone on the planet get into their central banking business of creating digital money out of thin air.
The solution...... get interest rates significantly higher so that Bitcoin, Bitcash, ethereum,, Ripple, LiteCoin, Monero, Ethereum Classic, Dash, MaidSafeCoin, Augar, and NEM
those were the top 10 Cryptocurrencies by market capitalization in January of 2017
atozforex.com
which do not have a yield become less attractive stores of value when we get interest rates on the 30 year up to 4.46% which will be 178 basis point up in a 1.618 move off of the wave 2 low made this week, added to the 1.10 basis point advance from 2.10 on 7/8/16 up to the wave 1 high of 3.197 made on Dec 16th of
2016. This will normalize interest rate and enable Major Pension funds, endowment funds, Insurance companies , as well as savers and folks over 50 who have had the blood squeezed out of them by not being able to get any yield in a Non risky asset class.
When the yield on the 10 year and 30 year note go higher, it leads to a multiple contraction as the earnings
yield and dividend yield on stocks becomes less attractive and equities are riskier assets. However, It is likely going to take quite a period of time, quite possibly many months, possibly a year for the 10 year note
to exceed 3%... It is really unknowable at this juncture.
This Chart was posted on Sept 2nd, and due to the extreme exegencies of Hurricane Harvey and the soon to be emerging Hurricane Irma, coupled with some ECB machinations..... we also briefly got down to almost 2% in yield overnight during the weekend of Hurricane Irma.
and moved like grease lightening of of that 2.00% area briefly touched overnight and in the overseas markets and vaulted back to 2.35% with such impulse power... accompanied by upside gaps that I doubt we see 2.13% again this year, which is a key level from several FIbonacci cluster, GANN price zones as well
as it's a critical level so that the yield curve does not start to de facto invert.regarding a number of large derivative interest rate swaps geared to that level.
The Strength of the rally has been broadly impressive, At the start of the year I was a very large advocate
that the Congress should not attempt to lead with a replacement of the ACA as it was the mathematically
hardest program to deal with, and should instead focus on a restructuring of the tax code, a 1 time
special time window where US companies could repatriate the 1.5 to 4 Trillion dollars that they hold offshore back to the US at a 6.5% rate, which was what was done in the Reagan - Tip O'Neil compromise /
tax reform of 1986. Also that the administration focus on reducing and stream lining the overly cumbersome regulatory environment. Studies are coming out that the DJT administration has made significant inroads
in the reduction of federal regulatory overreach and that is one of the strong tail winds that the stockmarket
has experienced all year.
Now that the repeal of the ACA has been shelved, the US congress can focus on coming up with a
tax reform and simplification bill and one that makes the USA more competitive globally. Steve Liesman,
of CNBC had excellent statistics showing that Republicans are much more positive on the economy than
they were under the Obama administration, Democrats do not feel as strongly as Republicans that the
economy is more conducive towards business but the numbers have improved from the BHO admin.
And Independent voters have swung from a negative 16% view of economic prospects to a positive view
of 18% . In all 3 cases quite significant swings. This should not be underestimate.
The market rally several weeks ago was lead by the energy stocks, the material stocks, and small
capitalization stocks and has been broadening out recently as the SPX moved above it's upper Bollinger
Band for the first time since early July, and before that it was the 3 week of April that witnessed the BB
breaking above it's upper boundary
On the SPX the Money Flow Index has been persistently strong and is in a buy signal on it's Moving average crossover system. the RSI has made a new momentum high for the rally . It is the first time we have had such strong reading since we reached 2400 on March 1st 2017. The move above the BB, suggests a higher high to come as does the new high in momentum on the ROC models and the RSI model. Also the Chaikin Money flow index has reached a new high for the year which is a powerful statement of how strong the accumulation on this rally is.
We have a most interesting dynamic with the Global Central Bankers having created 17 Trillion dollars and counting of Global Credit expansion via, Quantitative easing programs,Twist Operations by the FED, The whole sale purchase of Sovereign debt, and the BOJ, ECB, the Riksbank the BOE, and other central
banks have purchased Trillions of dollars of bonds, corporate debt and other debt obligations, equities , real estate in some cases ( I believe) and the CB's multi year campaign to create zero short rates in the US and Negative interest rates not only in the short end of the yield curve but also the long end of the curve in Japan, Euroland, Switzerland, Sweden,Denmark....etc. (oh and one aspect not talked about much is that the 4.6 trillion in US Government securities on the FED's balance sheet are throwing off cash flow payments, as is the price appreciation of the equities and debt instruments in the Bank of Japan's portfolio as well as in the EuropeanCentral Bank, thus the numbers on the global CB balance sheets are increasing..... possibly quicker than they can be rolled off.... unless for some reason the global CB got very aggressive in balance sheet reduction.
The unprecedented magnitude and nature can be amply be demonstrated by the deepest and most
interconnected degree of global central bank coordination in Human history. This is self evident by the
extent that the global CB's created ZIRP, QE programs and the driving of the entire yield cure including the
long end of the yield curve into negative yield in so many major countries.
We now have an equally unprecedented event transpiring with the Central banks now all attempting to
normalize their yield curves and normalized interest rates. It is completely unknown and unknowable
exactly how well or how poorly the various countries and central banks which have wildly dissimilar economic
conditions, values of their currencies, demographics, Debt to GDP levels, levels of economic
growth, wildly differing increases and potential bubbles in residential and commercial real
estate in their major hub cities. Think Vancouver, Sydney, Auckland Hong Kong even Swenden.
I am fairly certain that the Foreign Exchange relationships in the global currencies markets are going to be the hardest aspect that the Central Banks and the governments of the world will have to deal with as this
multiyear interest rate normalization transpires. The Interest rate differentials between the various key
currencies in the world especially the big 5, EUR, JPY, USD, GBP, YUAN.
The $64,000 question....... is how well will these central banks be able to be able to work in unison to
raise global interest rates and normalize the interest rate and structures of the yield curves around
the world.
Jeffrey Saut of Raymond James who is one of the more savvy market participants I know outlined a
distinctly bullish secular case for US and global equity prices. He stated, that bull markets have 3 stages.
The first leg of the long term multi year secular bull driven by supremely low interest rates started on 03/09/2007 and then topped in June 2015 again.... driven by super low interest rates..... into the February Crude oil crash lows where The Royal Bank of Scotland was saying to sell everything.
He now feels that we are in the early innings of the second stage of a idealized (possibly 18-21 year) secular bull market which will be driven by earnings growth....... the third Stage (in his scenario) will be another very speculative mania ala 1928-29 in the US, the late 1980's in Japan, and the .com and B2B Bubble Market of the late 1990s which peaked in March of 2000. after the FED had Y2K concerns ameliorated. (the very last flourish of the Y2K concern was that February 29th of 2000 was a leap year... there was some slight concern that it being a leap year in the new millennium might mess with the legacy COBOL computer.systems.
Jeff Saut has no idea when this second phase of the multiyear secular bull market will end and let us remember that this is one viewpoint.
The Future is always playing out so radically different than even the most prescient of our thought leaders envision, it is wise to remain flexible, have an asset allocation plan which is prudent for each individual and or course will be different.....adapt to market developments as they unfold
We shall let the Market Tell us WHAT THE MARKET WANTS TO DO.
FOOD FOR THOUGHT: the crosscurrents are as strong as ever between the deflationary nature of automation technological / machine learning / Deep Learning / AI autonomous driving, medical innovation etc on the one hand and the tremendous liquidity generation by the global CB's and the ever expanding ocean of cryptocurrencies now approaching 1000 in number. However the global market capitalization of the cryptocurrencies is still quite small... 137 Billion or so.
The 2% growth rate has been underwhelming. the numbers on Inflation in the US are still pretty tame as we
can see below.
And yet commodity prices particularly industrial commodities have risen this past year, the Baltic shipping rate national index is up substantially over the past number of months, the embedded inflation expectation
in 10 year US Treasury TIPS has increased significantly.
The out-performance of material stocks, energy stocks, small cap and industrial stocks all can be attributed
to sector rotation, however it also suggests that a sense that inflation is in the process of picking up. The
central statement that can be said is that GDP growth and these other inflationary signs have been
so far underwhelming.
As Jim Paulsen has pointed out though in the same interview as Jeffrey Saut on CNBC. We have an
entire generation of people who are now conditioned to expect extremely low interest rates and they are used to long term rates of 2% or so. This generation will be extremely shocked and amazed if long term interest rates were to revert to a 3.5 to 4% level, let alone the historical norm of possibly 5%.
Right now with interest rates we are in the real sweet spot where they are not too low and not too high,
and the sweet spot has the ability to propel the US stock market and the Emerging economy stock markets, that even with their rally the emerging markets have a P/E of around 10. while we have this window where
US rates are not too hot and not too cold but just right.... it is providing a very large tail wind for US
equities, September which seasonally is a very weak month proved to be a very strong month for stocks
this year. This is indicative of the very serious aspect that we have these very constructive and powerful,
structural reforms occurring in the US economy, the entire world senses that the US administration is
very pro business and that is globally reassuring for the international business climate and the psychological state of the Global 500 companies.
JJP
------------------------------------------------------------------------------------------------------------------------------------
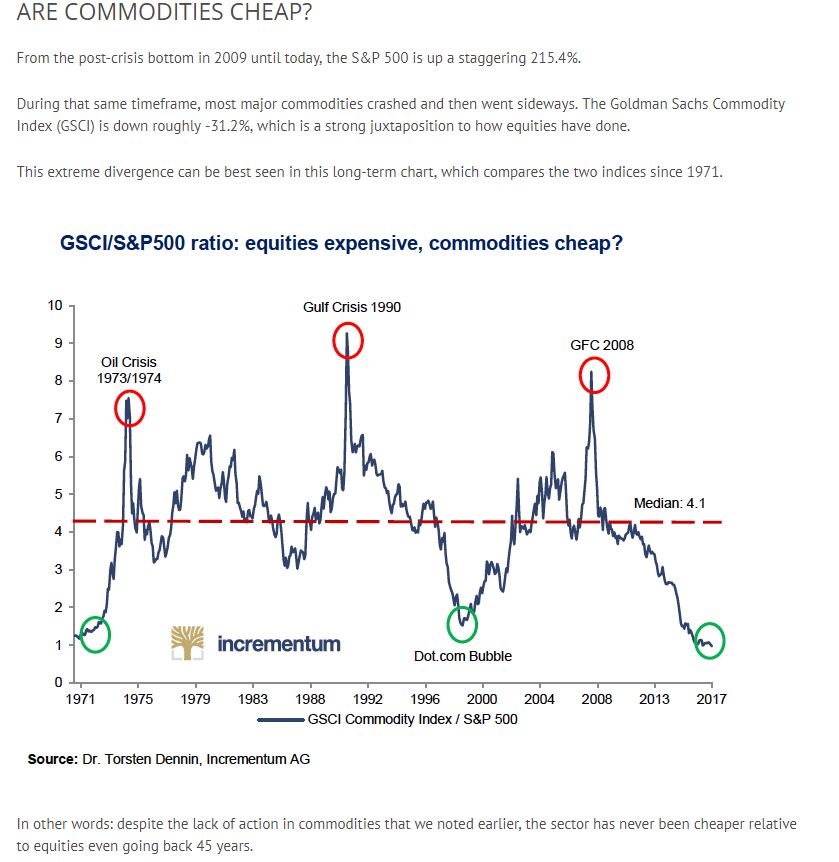
This is a VERY PROFOUND CHART...... In has Implications for Equity Prices, Commodity prices,
Interest Rate directions and also will be impacting the Major Currencies.
The first leg of the long term multi year secular bull driven by supremely low interest rates started on 03/09/2007 and then topped in June 2015 again.... driven by super low interest rates..... into the February Crude oil crash lows where The Royal Bank of Scotland was saying to sell everything.
He now feels that we are in the early innings of the second stage of a idealized (possibly 18-21 year) secular bull market which will be driven by earnings growth....... the third Stage (in his scenario) will be another very speculative mania ala 1928-29 in the US, the late 1980's in Japan, and the .com and B2B Bubble Market of the late 1990s which peaked in March of 2000. after the FED had Y2K concerns ameliorated. (the very last flourish of the Y2K concern was that February 29th of 2000 was a leap year... there was some slight concern that it being a leap year in the new millennium might mess with the legacy COBOL computer.systems.
Jeff Saut has no idea when this second phase of the multiyear secular bull market will end and let us remember that this is one viewpoint.
The Future is always playing out so radically different than even the most prescient of our thought leaders envision, it is wise to remain flexible, have an asset allocation plan which is prudent for each individual and or course will be different.....adapt to market developments as they unfold
We shall let the Market Tell us WHAT THE MARKET WANTS TO DO.
FOOD FOR THOUGHT: the crosscurrents are as strong as ever between the deflationary nature of automation technological / machine learning / Deep Learning / AI autonomous driving, medical innovation etc on the one hand and the tremendous liquidity generation by the global CB's and the ever expanding ocean of cryptocurrencies now approaching 1000 in number. However the global market capitalization of the cryptocurrencies is still quite small... 137 Billion or so.
The 2% growth rate has been underwhelming. the numbers on Inflation in the US are still pretty tame as we
can see below.
And yet commodity prices particularly industrial commodities have risen this past year, the Baltic shipping rate national index is up substantially over the past number of months, the embedded inflation expectation
in 10 year US Treasury TIPS has increased significantly.
The out-performance of material stocks, energy stocks, small cap and industrial stocks all can be attributed
to sector rotation, however it also suggests that a sense that inflation is in the process of picking up. The
central statement that can be said is that GDP growth and these other inflationary signs have been
so far underwhelming.
As Jim Paulsen has pointed out though in the same interview as Jeffrey Saut on CNBC. We have an
entire generation of people who are now conditioned to expect extremely low interest rates and they are used to long term rates of 2% or so. This generation will be extremely shocked and amazed if long term interest rates were to revert to a 3.5 to 4% level, let alone the historical norm of possibly 5%.
Right now with interest rates we are in the real sweet spot where they are not too low and not too high,
and the sweet spot has the ability to propel the US stock market and the Emerging economy stock markets, that even with their rally the emerging markets have a P/E of around 10. while we have this window where
US rates are not too hot and not too cold but just right.... it is providing a very large tail wind for US
equities, September which seasonally is a very weak month proved to be a very strong month for stocks
this year. This is indicative of the very serious aspect that we have these very constructive and powerful,
structural reforms occurring in the US economy, the entire world senses that the US administration is
very pro business and that is globally reassuring for the international business climate and the psychological state of the Global 500 companies.
JJP
------------------------------------------------------------------------------------------------------------------------------------
This is a VERY PROFOUND CHART...... In has Implications for Equity Prices, Commodity prices,
Interest Rate directions and also will be impacting the Major Currencies.
---------------------------------------------------------------
.
------
. |
|


