We've detected that you're using an ad content blocking browser plug-in or feature. Ads provide a critical source of revenue to the continued operation of Silicon Investor. We ask that you disable ad blocking while on Silicon
Investor in the best interests of our community. If you are not using an ad blocker but are still receiving this message, make sure your browser's tracking protection is set to the 'standard' level.
The Atlantic Ocean circulation that carries warmth into the Northern Hemisphere’s high latitudes is slowing down because of climate change, a team of scientists asserted Wednesday, suggesting one of the most feared consequences is already coming to pass.
The Atlantic meridional overturning circulation has declined in strength by 15 percent since the mid-20th century to a “new record low,” the scientists conclude in a peer-reviewed study published in the journal Nature. That’s a decrease of 3 million cubic meters of water per second, the equivalent of nearly 15 Amazon rivers.
The AMOC brings warm water from the equator up toward the Atlantic’s northern reaches and cold water back down through the deep ocean. The current is partly why Western Europe enjoys temperate weather, and meteorologists are linking changes in North Atlantic Ocean temperatures to recent summer heat waves.
The circulation is also critical for fisheries off the U.S. Atlantic coast, a key part of New England’s economy that have seen changes in recent years, with the cod fishery collapsing as lobster populations have boomed off the Maine coast.
Some of the AMOC’s disruption may be driven by the melting ice sheet of Greenland, another consequence of climate change that is altering the region’s water composition and interrupts the natural processes.
This is “something that climate models have predicted for a long time, but we weren’t sure it was really happening. I think it is happening,” said one of the study’s authors, Stefan Rahmstorf of the Potsdam Institute for Climate Impact Research in Germany. “And I think it’s bad news.”
The Atlantic meridional overturning circulation (AMOC)—a system of ocean currents in the North Atlantic—has a major impact on climate, yet its evolution during the industrial era is poorly known owing to a lack of direct current measurements. Here we provide evidence for a weakening of the AMOC by about 3?±?1 sverdrups (around 15 per cent) since the mid-twentieth century. This weakening is revealed by a characteristic spatial and seasonal sea-surface temperature ‘fingerprint’—consisting of a pattern of cooling in the subpolar Atlantic Ocean and warming in the Gulf Stream region—and is calibrated through an ensemble of model simulations from the CMIP5 project. We find this fingerprint both in a high-resolution climate model in response to increasing atmospheric carbon dioxide concentrations, and in the temperature trends observed since the late nineteenth century. The pattern can be explained by a slowdown in the AMOC and reduced northward heat transport, as well as an associated northward shift of the Gulf Stream. Comparisons with recent direct measurements from the RAPID project and several other studies provide a consistent depiction of record-low AMOC values in recent years.
Everything revolves around the question of whether the Gulf Stream System has already weakened. Climate models predict this will be one consequence of global warming – alongside other problems such as rising sea levels and increasing heat waves, droughts and extreme precipitation. But is such a slowdown already underway today? This question is easier asked than answered. The Atlantic Meridional Overturning Circulation (AMOC, also known as Gulf Stream System) is a huge, three-dimensional flow system throughout the Atlantic, which fluctuates on different time scales. It is therefore by no means enough to put a current meter in the water at one or two points.
Since 2004 there has been a major British-American observation project, called RAPID, which tries to measure the total flow at a particularly suitable latitude (26.5° North) with 226 moored measuring instruments. This provides good results and shows a notable slowdown – but only since 2004, and probably the change over such a short period of time is mainly due to natural fluctuations and in itself hardly reveals anything about the possible effects of climate change.
If you want to look further back in time, you have to look for other sources of evidence. In my view, it is the ocean temperatures that are most likely to solve the mystery – because firstly, there is a lot of good data and, secondly, the AMOC has a dominant influence on sea temperatures in large parts of the North Atlantic. In our study – together with colleagues from Princeton and the University of Madrid – we therefore compare all available measurement data sets since the late 19th century with a simulation of a climate model in which the ocean currents are computed in very high resolution.
–
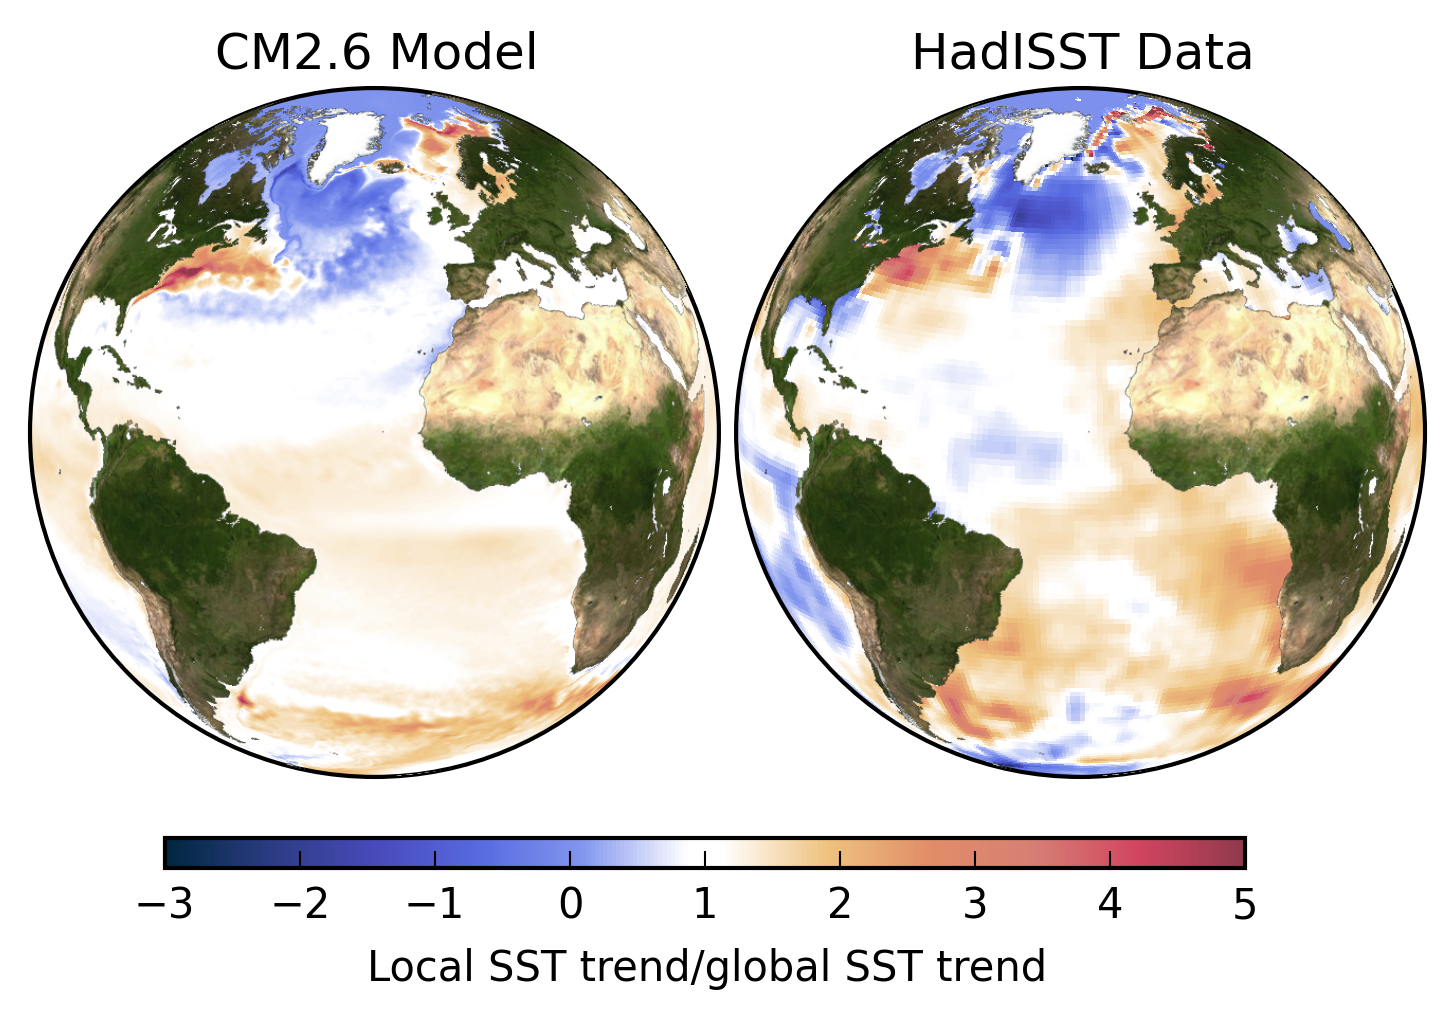
This model simulation took six months on 11,000 processors (9,000 of them for the ocean alone) of the high-performance computer at NOAA’s Geophysical Fluid Dynamics Laboratory in Princeton. The central result is shown in Fig. 1 (left).
Click for Larger Fig. 1 Trends in sea surface temperatures. Left: in the climate model CM2.6 in a scenario with a doubling of the amount of CO2 in the air. Right: in the observation data from 1870 to the present day. In order to make the trends comparable despite the different periods and CO2 increases, they were divided by the globally averaged warming trend, i.e. all values above 1 show an above-average warming (orange-red), values below 1 a below-average warming, negative values a cooling. Due to the limited availability of ship measurements, the measurement data are much more “blurred” than the high-resolution model data. Graph: Levke Caesar
In the North Atlantic, the measured values differ markedly from the average global warming: the subpolar Atlantic (an area about half the size of the USA, south of Greenland) has hardly warmed up and in some cases even cooled down, contrary to the global warming trend. In contrast, a wide area along the American east coast has warmed up at an excessive rate. Both can be attributed to a weakening of the AMOC in the model simulation. The cooling is simply due to the reduced heat input from the AMOC. The excessive warming, on the other hand, is based on a somewhat more nerdy mechanism that has been known to experts for some time: if the AMOC weakens, the Gulf Stream shifts closer to the coast. (This has to do with conservation of angular momentum on the rotating globe.)
The model thus shows a fairly characteristic “fingerprint” of sea surface temperatures as the AMOC weakens. We now wanted to know what temperature changes the observational data show since the late 19th century. My doctoral student Levke Caesar evaluated the various data sets. They show a very similar pattern – see the right globe in Figure 1 – and the annual cycle of change – more cooling in winter – also corresponds to that of the model simulation. I know of no other mechanism that could explain this spatial and temporal pattern than a weakening of the AMOC. Such a slowdown as a result of our greenhouse gas emissions has long been predicted by climate models – these data show that it is already underway.
Weaker than for over a thousand years
Another new study ( Anomalously weak Labrador Sea convection and Atlantic overturning during the past 150 years by David Thornalley and colleagues) was published in the same issue of Nature, which supports this finding and places it in a longer climate history context. The authors used two types of data from cores in sediments at the seabed – so-called ‘proxy data’. These deposits gradually accumulate over thousands of years and tell us what happened in the ocean in the past. Naturally fuzzier than modern observations – but reaching much further back in time, in this case 1600 years.
The first data series – from calcareous shells of marine organisms that live 50 to 200 metres below the sea surface in the northern Atlantic – shows the temperature conditions there. From these, the strength of the heat transport and thus the flow can be deduced, similar as in our study. A second data series is based on the grain size of the sediments at two points at a depth of 1700 and 2000 metres – where part of the water brought northwards by the Gulf Stream flows back towards the south as a cold deep current. The neat thing is that the current sorts the sediment. Coarse grain size of the sediments indicates a strong flow, finer grain size indicates a weaker flow, to put it as a simple rule of thumb.
The authors conclude from their data that the AMOC has never been as weak in all those previous centuries as in the last hundred years. This supports an earlier conclusion of a study I led in 2015, where we had already concluded this for the last 1100 years – based on a completely different, independent database.
Below, my interview with ice core expert Jorgen Peder Steffenson, in Greenland, 2017.