The Effect of Concealed Weapons Laws: An Extreme Bound Analysis William Alan Bartley and Mark Cohen ()
Economic Inquiry, 1998, vol. 36, issue 2, 258-65
Abstract: John R. Lott and David B. Mustard (1997} provide evidence that enactment of concealed handgun ('right-to-carry') laws deters violent crime and induces substitution into property crime. A critique by Dan A. Black and Daniel S. Nagin (1998) questions the particular model specification used in the empirical analysis. In this paper, the authors estimate the 'model uncertainty' surrounding the model specified by Lott and Mustard using an extreme bound analysis (Edward Leamer 1983). They find that the deterrence results are robust enough to make them difficult to dismiss as unfounded, particularly those findings about the change in violent crime trends. The substitution effects are not robust with respect to different model specifications. Copyright 1998 by Oxford University Press.
econpapers.repec.org
The study, which just appeared in Volume 30, Number 2 of the Harvard Journal of Law & Public Policy (pp. 649-694), set out to answer the question in its title: “Would Banning Firearms Reduce Murder and Suicide? A Review of International and Some Domestic Evidence.” Contrary to conventional wisdom, and the sniffs of our more sophisticated and generally anti-gun counterparts across the pond, the answer is “no.” And not just no, as in there is no correlation between gun ownership and violent crime, but an emphatic no, showing a negative correlation: as gun ownership increases, murder and suicide decreases.
theacru.org
Zero correlation between state homicide rate and state gun laws
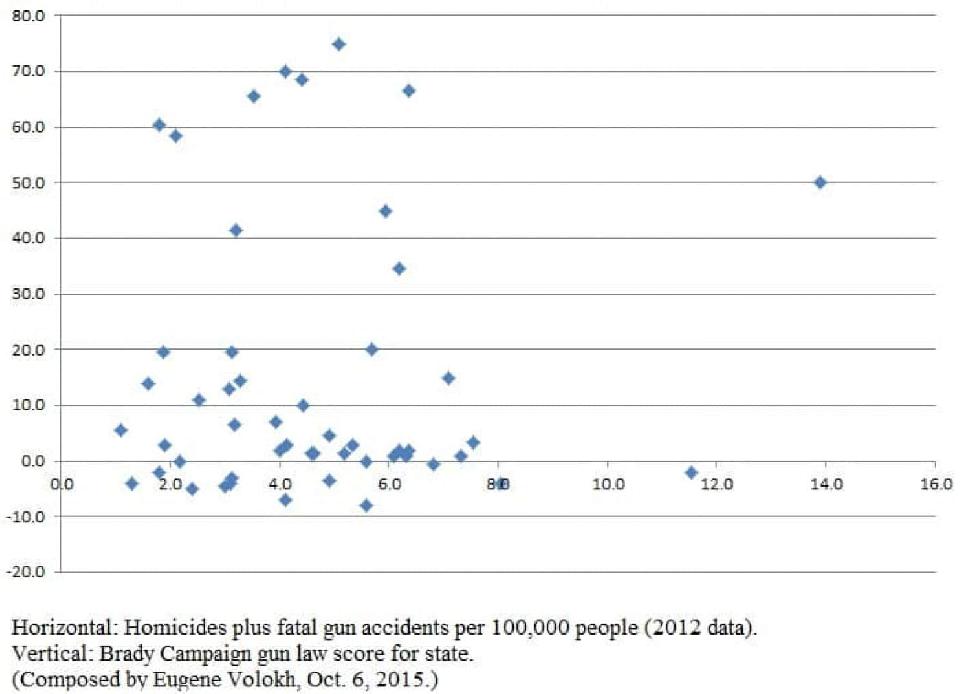
The correlation between the homicide rate and Brady score in all 51 jurisdictions is +.032 (on a scale of -1 to +1), which means that states with more gun restrictions on average have very slightly higher homicide rates, though the tendency is so small as to be essentially zero. (If you omit the fatal gun accident rates, then the correlation would be +.065, which would make the more gun-restricting states look slightly worse; but again, the correlation would be small enough to be essentially zero, given all the other possible sources of variation.) If we use the National Journal data (adding the columns for each state, counting 1 for each dark blue, which refers to broad restrictions, 0.5 for each light blue, which refers to medium restrictions, and 0 for each grey, which refers to no or light restrictions), the results are similar: +0.017 or +0.051 if one omits the fatal gun accident rates. You can also run the correlation yourself on my Excel spreadsheet.
washingtonpost.com
After collating gun ownership rates with FBI violent crime rates, other interesting correlations appear:
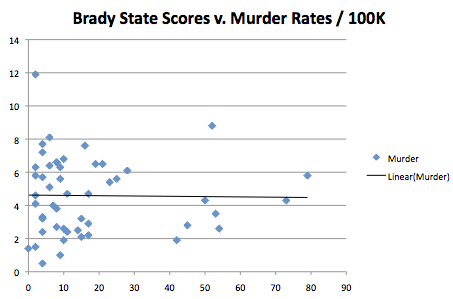
- As gun ownership levels increase, Brady grades decrease.
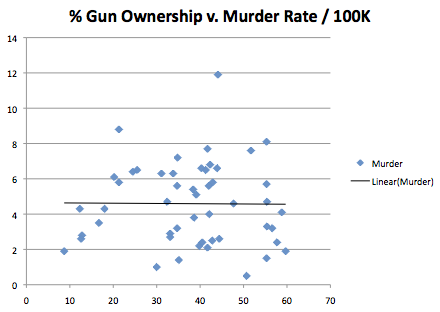
- States with higher gun ownership levels have less violent crime and murder.
| Gun Ownership vs. Brady, Violent Crime, Murder | Percent GunOwnership
| 2001 | 2002 | Ave.Grade
| FBI Rates | Ave.Grade
| FBI Rates | | Violence | Murder | Violence | Murder | | Under 30% | B+ | 610.0 | 7.6 | B+ | 599.7 | 8.2 | | 30-40% | D+ | 424.5 | 4.9 | D+ | 422.4 | 5.0 | | 40-50% | D+ | 410.7 | 4.9 | D+ | 406.5 | 4.8 | | Over 50% | D- | 319.6 | 4.2 | D- | 314.8 | 3.9 |
Brady’s “reasonable” gun control correlates with reduced gun ownership and higher rates of overall violence and murder.
Collating gun ownership rates with Centers for Disease Control (CDC) homicide data underscores the above conclusions:
- States with the lowest firearms ownership average the highest firearm and non-firearm homicide rates.
- As firearms ownership rates increase, homicide rates generally decrease.
- States with the highest gun ownership have the lowest firearms homicide rates.
| Gun Ownership vs. CDC Homicide Rates | Pct. GunOwnership
| 2001 | 2002 | | Total | Firearm | Non-FA | Total | Firearm | Non-FA | | Under 30% | 9.32 | 4.90 | 4.42 | 8.09 | 5.61 | 2.47 | | 30-40% | 5.52 | 3.31 | 2.20 | 5.47 | 3.46 | 2.01 | | 40-50% | 5.63 | 3.58 | 2.04 | 5.24 | 3.49 | 1.75 | | Over 50% | 5.12 | 3.22 | 1.90 | 5.22 | 3.18 | 2.04 |
(Note: the CDC collects information from death certificates, while the FBI collects data from law enforcement agencies.)
...
When Brady’s grades were collated with CDC firearm and non-firearm homicide rates for Americans of African descent:
- Brady’s favorite states experienced the highest rates of homicide.
- The general trend indicates that as Brady grades decline, so do homicide rates.
- Brady’s “worst” states experienced the lowest rates of firearms and non-firearms homicide.
| Brady Grades Versus CDC African American Homicide Rates | | Grade | 2001 | 2002 | | Total | Firearm | Non-FA | Total | Firearm | Non-FA | | A | 22.62 | 17.26 | 5.37 | 23.35 | 17.78 | 5.56 | | B | 20.39 | 12.73 | 7.66 | 21.88 | 16.54 | 5.34 | | C | 19.66 | 14.23 | 5.42 | 18.45 | 13.93 | 4.52 | | D | 16.83 | 12.60 | 4.23 | 17.24 | 11.99 | 5.25 | | F | 11.96 | 9.94 | 2.02 | 11.43 | 8.75 | 2.67 |
These data show that law-abiding Americans are safest where they have the easiest access to firearms, rendering Henigan’s premise invalid.
pjmedia.com
4. States that allow registered citizens to carry concealed weapons have lower crime rates than those that don’t.
True. The 31 states that have “shall issue” laws allowing private citizens to carry concealed weapons have, on average, a 24 percent lower violent crime rate, a 19 percent lower murder rate and a 39 percent lower robbery rate than states that forbid concealed weapons. In fact, the nine states with the lowest violent crime rates are all right-to-carry states. Remarkably, guns are used for self-defense more than 2 million times a year, three to five times the estimated number of violent crimes committed with guns.
cato.org
Gun Ownership and Murder Rates – No Apparent Association
This correlation could be spurious, especially since analysis of time-series data is often afflicted by problems of isolating general trends from variable-effects, and, as with all statistical analysis, the results are often highly contingent upon model specification (for a critique, see this) . But it nonetheless cast doubt on the common prejudice (in the western world) that more guns means more violent crime and murder.
“If the mantra (more guns = more death/fewer guns = less death) were true should not broad based cross-national comparisons show that nations with higher gun ownership per capita consistently have more death? But nations with higher gun ownership rates do not have higher murder (or suicide) rates than do those with lower gun ownership. Indeed many high gun ownership nations have much lower murder rates. Consider the wide divergencein murder rates among Continental European nations with widely divergent gun ownership rates. (Actually, those nations with least gun ownership generally seem to have the highest murder rates.)
The non-correlation between gun ownership and murder is reinforced by examination of statistics from larger numbers of nations across the developed world. Comparison of “homicide and suicide mortality data for thirty-six nations (including the United States) for the period 1990-1995? to gun ownership levels showed “no significant (at the 5% level) association between gun ownership and the total homicide rate.”32 Consistent with this is a later European study of data from 21 nations in which “no significant correlations [of gun ownership levels] with total suicide or homicide rates were found.””
...The more thorough analysis is comprised by scrutiny of the patterns at macrolevel, as well as a range of comparative case studies, mainly of former Commonwealth countries. But there is a section which compares, albeit superficially, the geographical patterns of gun ownership and violence/murder rates, in the western world. From the section on Europe (p. 30):
“Consider Norway, its neighbors Sweden, and (across the Baltic and North Seas respectively) Holland and Denmark. Norway has far and away Western Europe’s highest household gun ownership (32%), but also its lowest murder rate. Holland has the lowest gun ownership in Western Europe (1.9%), and Sweden lies midway between (15.1). Yet the Dutch murder rate is half again higher than the Norwegian, and the Swedish rate is even higher yet, though only slightly. (See Table 5 infra.) These comparisons are reinforced by Table 6, which gives differently derived (and noncomparable) gun ownership rates, overall murder rates, and rates of gun murder, for a larger set of European nations.118 Reference to Table 6 reveals that though Sweden has more than double the rate of gun ownership as neighboring Germany, and more gun murders, it has 25% less murder overall. In turn, Germany, with three times the gun ownership rate of neighboring Austria as well as a higher gun murder rate, has a substantially lower murder rate overall.” thevanishingpoint.wordpress.com
pagunblog.com
Here is a graph of guns vs. gun homicides: 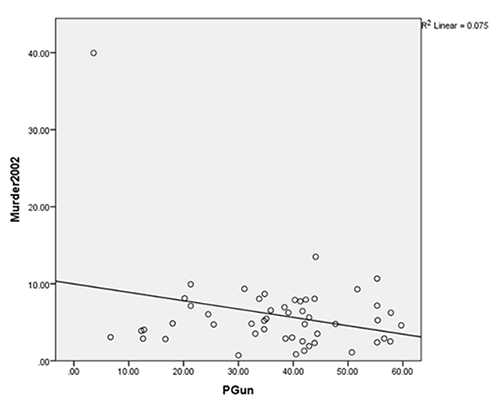
The relationship between gun ownership and homicide is weak (and appears negative) |


