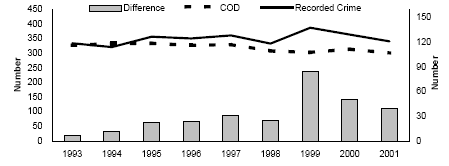
I didn't say murder rates have not gone down. In fact in the case of Australia I specifically said otherwise that they did go down. Its just that they went down at least as much, apparently more, in the US over the same time period while the US was liberalizing concealed carry and why the number of guns in private hands in the US went up.
--------
Make no mistake about it, Australia is a generally peaceful country with a 2014 murder rate of 1.0 victims per 100,000 persons and an overall homicide rate, including manslaughter, of 1.8. In 2000 the Australian Institute of Criminology reported "the homicide rate for Australia has stayed remarkably constant. The highest rate recorded over the last 11 years was 2 per 100,000 and the lowest rate was 1.7 per 100,000." So in the intervening years, they've basically seen a continuation of the "modest decline" referred to in the academic assessment cited above.
By contrast, without Australia's confiscation policy, the United States has seen its murder (including nonnegligent manslaughter) rate drop from 9.3 homicides per 100,000 U.S. residents in 1992 to 4.7 in 2011 and decline further, to 4.5 per 100,000 in 2014, the last year for which full data is available. During this time, the number of firearms in civilian hands increased by roughly 50 percent, to an estimated 300 million.
reason.com
Abstract
The development of legislation aimed at reducing the incidence of firearm-related death is an ongoing interest within the spheres of criminology, public policy, and criminal justice. Although a body of research has examined the impacts of significant epochs of regulatory reform upon firearm-related suicides and homicides in countries like Australia, where strict nationwide firearms regulations were introduced in 1996, relatively little research has considered the occurrence of a specific type of homicide: mass shooting events. The current paper examines the incidence of mass shootings in Australia and New Zealand (a country that is socioeconomically similar to Australia, but with a different approach to firearms regulation) over a 30 year period. It does not find support for the hypothesis that Australia’s prohibition of certain types of firearms has prevented mass shootings, with New Zealand not experiencing a mass shooting since 1997 despite the availability in that country of firearms banned in Australia. These findings are discussed in the context of social and economic trends.
papers.ssrn.com
Number of murders in Australia from just before to several years after the "gun buyback"/confiscation/law changed.
First data by recorded cause of death (anything in parenthesis is my comment)
1995 - 333 (Year before the "gun buyback")
1995 - 326 (Year of the new gun laws)
1997 - 327 (No decline right away)
1998 - 307
1999 - 302
2000 - 313
2001 - 300
aic.gov.au
Then from recorded crime stats
1995 - 356
1996 - 350
1997 - 360
1998 - 332
1999 - 386
2000 - 363
2001 - 340
National Homicide Monitoring Program (NHMP) data. Not directly comparable to the other stats since its by fiscal year not calendar year
1995 - 343
1996 - 359
1997 - 318
1998 - 311
1999 - 341
2000 - 338
2001 - 317
Again from aic.gov.au
They also have a line chart of two of the data sets, recorded cause of death and recorded crime statistics. The former shows a slight decline, the later no significant trend.

aic.gov.au
aic.gov.au
Now to the US stats. One thing that will jump out is the much higher numbers. Of course the US is much bigger but the rates are higher here as well. The point is about the trends in the same time period (around and after Australia changed their gun laws).
See disastercenter.com
That has data for other years and other crimes not in the comparison period but its easy enough to extra the murders from 1995 onwards to the end of the data for the period
1995 - 21,610
1996 - 19,650
1997 - 18,208
1998 - 16,914
1999 - 15,522
2000 - 15,586
2001 - 16,037 (Last year from the data from three different sources that I have a working link to for Australia)
So Australia's Reductions from 1995 (year before the law changed)
By reported cause of death 1995-2001 - From 333 to 300 - A little under a 10 percent reduction
By recorded crime stats 1995-2001 - 356 to 340 - A little under 4 and a half percent decline
Using NHMP fiscal year data 95-'01 - 343 to 317 - Just over 7 and a half percent
US Data
1995 - 2001 - 21610 to 16037 - About 25.7 percent reduction. |


