gearing-up-for-a-busy-summer
streetwisereports.com
Gearing Up for a Busy Summer in the Golden Triangle
Contributed Opinion
Source: Thibaut Lepouttre for Streetwise Reports (5/22/18)
image: streetwisereports.com
 Calling it "one of the hottest exploration regions in Canada," Thibaut Lepouttre of Caesars Report describes how one company is preparing for the short summer exploration season. One of the hottest Canadian exploration regions in Canada in the past few years has been the Golden Triangle in British Columbia. Unfortunately the exploration season is pretty short, as companies have just a few months to get in and drill holes before the weather changes. This means exploration companies need to be able to hit the ground running to maximize their efforts. One of those companies is Aben Resources Ltd. (ABN:TSX.V; ABNAF:OTC.MKTS), which is getting ready to drill its flagship Forrest Kerr Gold project again. Calling it "one of the hottest exploration regions in Canada," Thibaut Lepouttre of Caesars Report describes how one company is preparing for the short summer exploration season. One of the hottest Canadian exploration regions in Canada in the past few years has been the Golden Triangle in British Columbia. Unfortunately the exploration season is pretty short, as companies have just a few months to get in and drill holes before the weather changes. This means exploration companies need to be able to hit the ground running to maximize their efforts. One of those companies is Aben Resources Ltd. (ABN:TSX.V; ABNAF:OTC.MKTS), which is getting ready to drill its flagship Forrest Kerr Gold project again.
image: streetwisereports.com
 The Flagship Forrest Kerr Property The Flagship Forrest Kerr Property
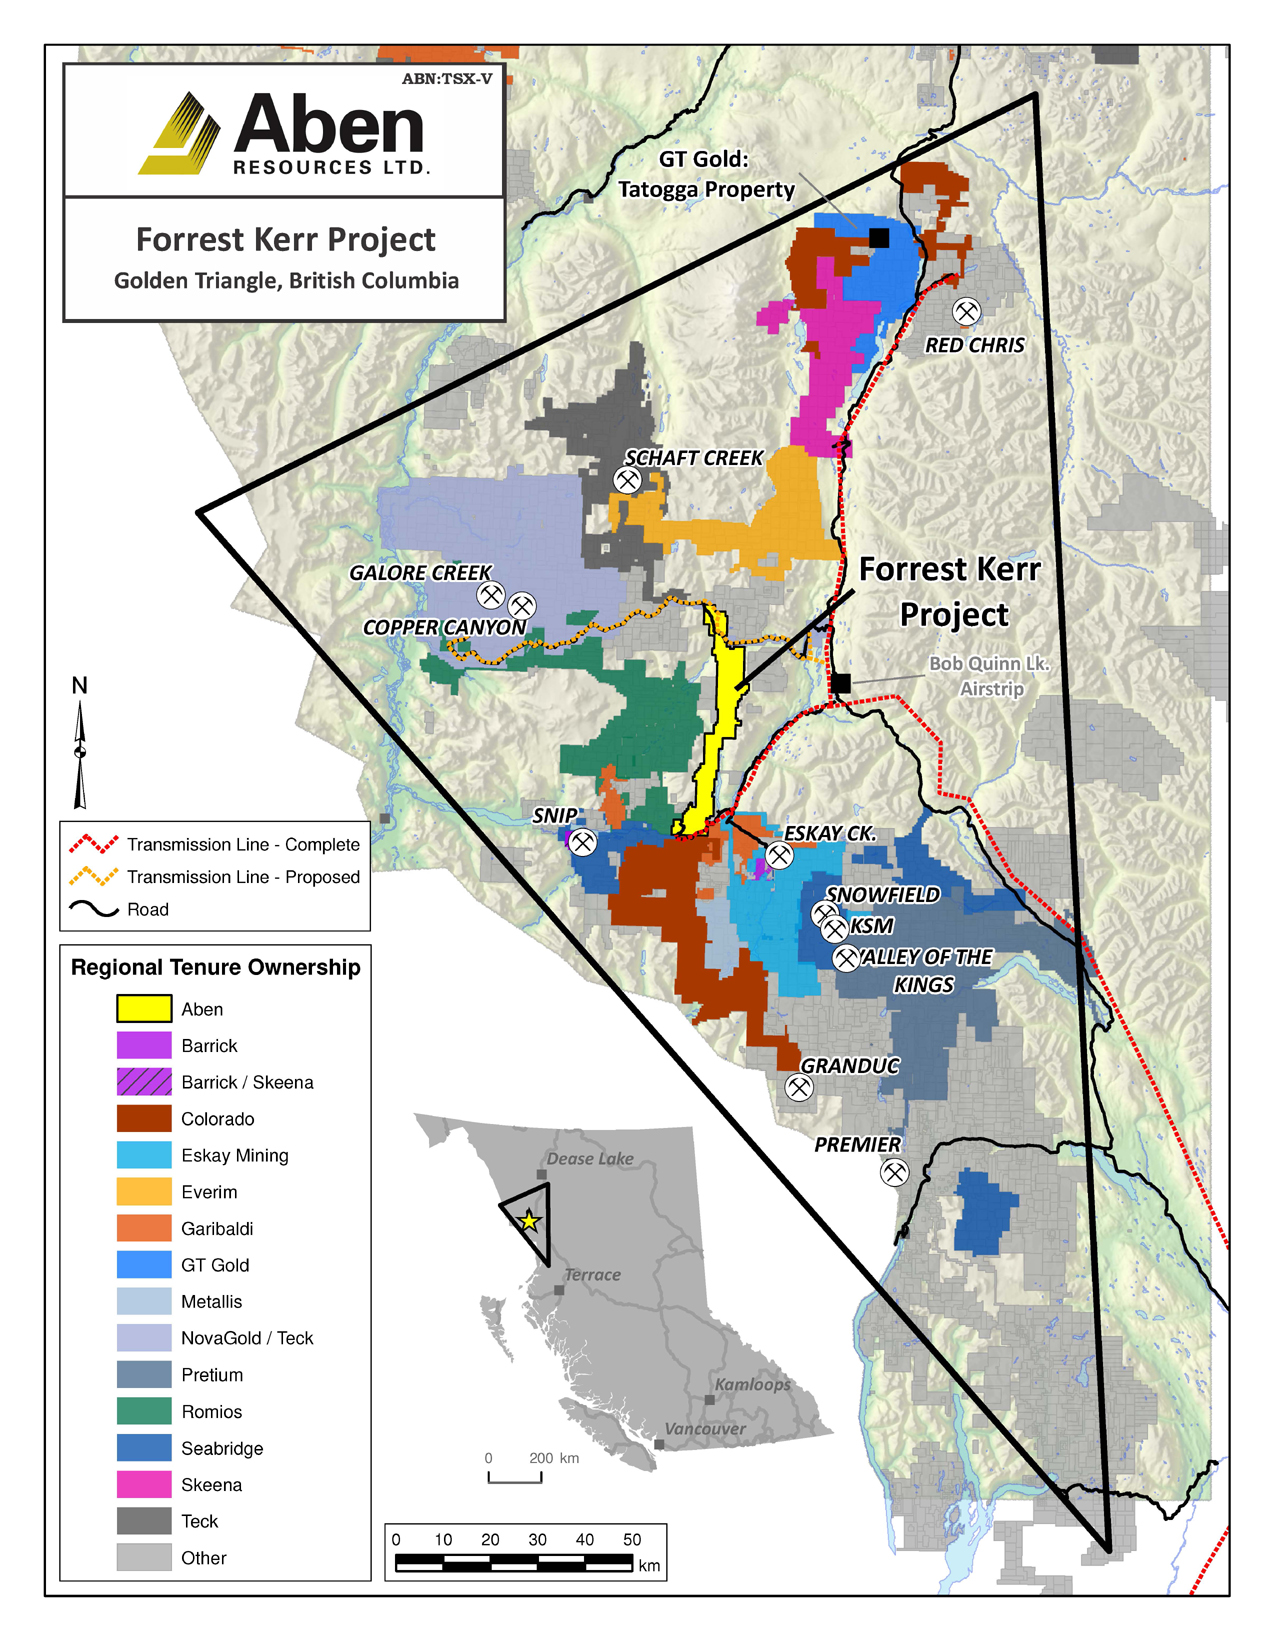
Aben Resources acquired the 23,000-hectare Forrest Kerr project in British Columbia's Golden Triangle region in 2016. This region was just heating up again after remaining dormant for a few decades. The development of the Valley of the Kings and Red Chris Mines (owned by respectively Pretium Resources Inc. [PVG:TSX; PVG:NYSE] and Imperial Metals Corp. [III:TSX]), as well as new infrastructure development by the government, has led to an increased level of exploration activity in the region.
The Golden Triangle has been the hot spot of gold exploration and production throughout the past few decades. Placer gold was initially discovered along the Stikine and Anuk Rivers in mid-1800s, and the exact point where both rivers combined was the scene of a new gold rush. These small-scale placer gold operations continued for several decades until a first mine was developed right after the First World War.
But the most famous mines in the Golden Triangle district were undoubtedly the Snip Mine (1.1 million ounces recovered at an average grade of 27.5 g/t gold) and the Eskay Creek Mine (producing 3 million ounces of gold and 160 million ounces of silver). A very prospective region, indeed.
Aben seems to have negotiated a good deal considering the company has to issue just 7 million shares and complete CA$3 million in exploration expenditures by June 2020. That gave Aben a four-year period (from 2016-2020) to test the merits of the project while incurring the expenses needed to reach full ownership of the project. It's very likely Aben will be completing its exploration expenses by the end of this year, which would secure its 100% ownership two years ahead of schedule.
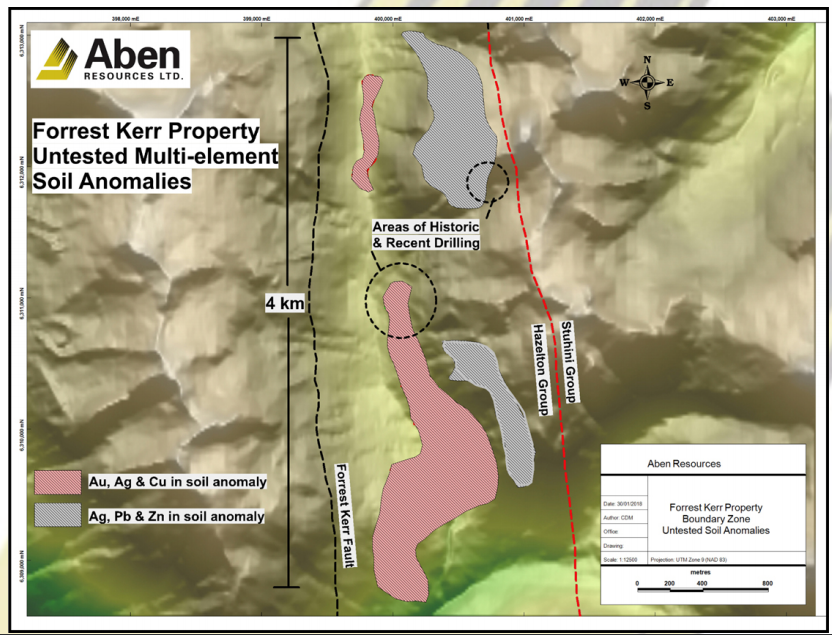
Looking at the historical data provided by the previous owners of the project, it's understandable that Aben's technical team was charmed by the property. Kiska Metals Corp. (KSK:TSX.V)(one of the previous operators) drilled a very short but ultra-high-grade interval of 0.45 meters containing 359.7 g/t gold and 1.95 meters containing 101 g/t gold. You obviously cannot expect these high-grade results to pop up everywhere on the property, but these intervals, combined with in excess of 20,000 samples, were a good enough reason for Aben to get back in the field for its 2016 and 2017 exploration programs.
image: streetwisereports.com
 After analyzing all the data gathered from the 2016 exploration season, Aben immediately designed a nine-hole drill program, completing 2,445 meters of diamond drilling in the summer of 2017. The first three holes were drilled at the Carcass Creek Zone and didn't immediately yield the expected/desired results as only short intervals of low-grade mineralization were encountered. Before the company could target the expected structure from a different angle, the drill program at Carcass was suspended for safety reasons, and the next six holes were drilled at the more important Boundary Zone. After analyzing all the data gathered from the 2016 exploration season, Aben immediately designed a nine-hole drill program, completing 2,445 meters of diamond drilling in the summer of 2017. The first three holes were drilled at the Carcass Creek Zone and didn't immediately yield the expected/desired results as only short intervals of low-grade mineralization were encountered. Before the company could target the expected structure from a different angle, the drill program at Carcass was suspended for safety reasons, and the next six holes were drilled at the more important Boundary Zone.
This zone was Aben's high-priority drill target after analyzing the 2016 assay results and fortunately these six holes did provide the desired results. A first batch of three holes was drilled from the same drill pad at different angles (45, 60 and 75 degrees), and encountered 10 meters at 6.7 g/t gold, 6.36 g/t silver and 0.9% copper (with a higher grade interval of 3 meters at 18.9 g/t gold, 16.6 g/t silver and 2.2% copper) in the first hole, followed by 12 meters of 10.9 g/t gold, 14.6 g/t silver and 1.5% copper in the second hole (drilled at a 60-degree angle). And the final hole of that series of three (drilled at a 75-degree angle) encountered 14 meters at 2.91 g/t gold, 5.2 g/t silver and 0.6% copper.
image: streetwisereports.com
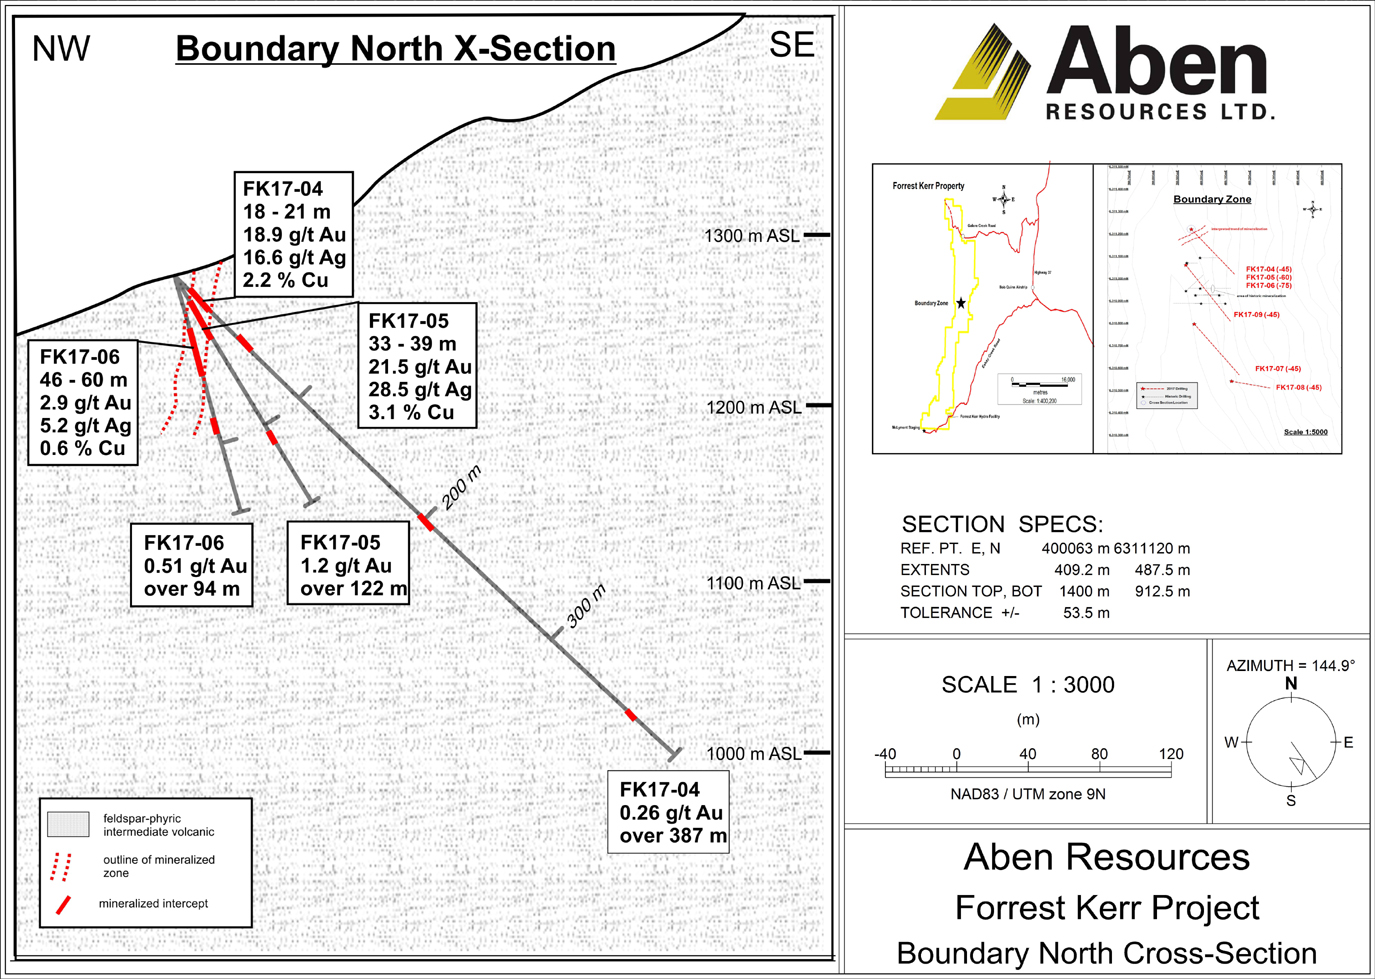 These are excellent high-grade results, indicating a narrow high-grade zone within a very broad mineralized zone, which Aben Resources will undoubtedly want to follow up on. It's still very early days at the Boundary Zone, but Aben now has a pretty good idea of how to make its 2018 drill program as efficient as possible. These are excellent high-grade results, indicating a narrow high-grade zone within a very broad mineralized zone, which Aben Resources will undoubtedly want to follow up on. It's still very early days at the Boundary Zone, but Aben now has a pretty good idea of how to make its 2018 drill program as efficient as possible.
It's now also cheaper to get an exploration program going in the Golden Triangle. The recent completion of major infrastructure works at and around the Golden Triangle have renewed the interest of exploration companies in this area as it's now easier to explore, and a discovered deposit now actually has a chance of becoming a mine without needing Snip-like grades. The Forrest Kerr property is definitely blessed with excellent access to infrastructure: a hydro dam has been built on the southern part of the property boundaries, and this resulted in the construction of access roads and, more importantly, a 287-kilovolt power line.
That's an important step forward. It doesn't increase the odds of finding a deposit (as you'll still need to apply "pure" geology), but it definitely makes it easier and cheaper to explore.
Share Structure
Although Aben Resources just raised CA$2.3M at CA$0.125 per share, it has done a great job keeping its share count under control. The company currently has just 78.1 million shares outstanding, and that's after issuing 6.3 million shares at CA$0.125/share in a hard-dollar financing, and 8.55 million flow-through shares at CA$0.18. Both tranches were accompanied by a three-year warrant with a strike price of CA$0.25 per warrant.
As Aben Resources still had some cash on its balance sheet, this recent raise increased the cash position to approximately CA$3.5 million. This means Aben is in great shape for the 2017 exploration season.
On top of that, it looks like Aben will be able to add more cash to its balance sheet over the next few months, as two series of warrants are currently in the money. With an exercise price of CA$0.10, 4.4M warrants will expire in November, while an additional 3.87 million warrants priced at CA$0.15 will expire on Dec. 29. As Aben's share price is trading firmly above the exercise prices of the warrants, we would expect some warrant holders have already started to exercise them.
Conclusion
Exploration isn't an exact science, and all companies like Aben can do is increase their odds by identifying the projects (and the targets on those projects) with a good probability of hitting something. And we think that's exactly what Aben Resources did in 2017 before the drill season in the Golden Triangle abruptly ended.
With CA$3.5 million in cash and an improved understanding of the gold mineralization in British Columbia's Golden Triangle compared to last year, Aben Resources seems to be ready to hit the ground running to follow up on the interesting drill results encountered at the Boundary zone in 2017.
Aben will be one of the first companies starting its field work in the Golden Triangle this year, so we would expect the company to be in the pole position to announce assay results throughout the summer. And having the first mover advantage could be important in this market, as it could allow the "early movers"to retain the attention of the market.
Thibaut Lepouttre is the editor of the Caesars Report, a newsletter and mining portal based in Belgium that covers several junior mining companies with a special focus on precious metals and base metals. Lepouttre has a Bachelor of Law degree and two economics masters degrees that have forged his analytical approach to the mining sector. Considered a number cruncher, Lepouttre focuses on the valuations of companies and is consistently on the lookout for the next undervalued mining company.
streetwisereports.com
Golden Triangle Stock Review
Contributed Opinion
Source: Clive Maund for Streetwise Reports (5/21/18)
Technical analyst Clive Maund takes a look at miners working in British Columbia's Golden Triangle.
image: streetwisereports.com
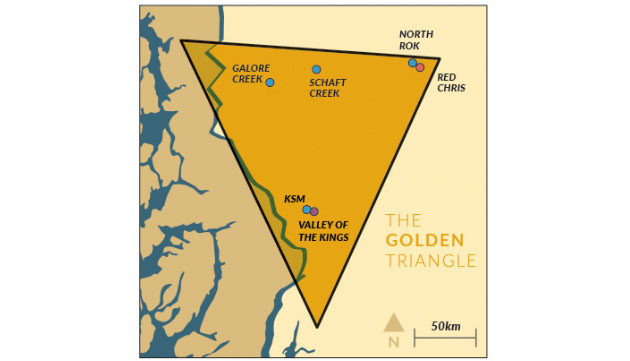
Golden Triangle, Credit: Visual Capitalist
We have looked at three exploration stocks working in British Columbia's Golden Triangle in recent months. Two of them are at about the same price as when we bought them, while the third is up significantly, and all three are expected to advance in coming months as the drilling season unfolds. They should go up even if gold doesn't go up, although it is expected to.
In this update we are going to review the technicals of these three stocks, and three new ones have been added. You will observe that since we are talking about the Golden Triangle here, this article started with three stocks, and has just been expanded to six stocks, which are, of course, multiples of the number of sides of a triangle.
The well-known Lawrence Roulston has got the fundamentals of the Golden Triangle well covered in his just published interview, Highly Anticipated Summer of Exploration in BC's Golden Triangle, which it is worth reading carefully. I, therefore, do not need to discuss them, but would draw your attention to the key third paragraph in Roulston's article, which, for convenience, is pasted in below, and also to the additional point he makes that the infrastructural situation in the Golden Triangle (roads, electricity, etc.) is vastly improved. From Roulston's article:
"After decades of traveling around the world looking for big high-grade metal deposits, I found the best area was right here in my backyard—the northwest part of British Columbia (B.C.), an area called the Golden Triangle. It's one of the most richly endowed mineral regions on the planet. The gold resources that have already been outlined in that region exceed the Carlin Trend, which is generally seen to be the biggest depository of gold on this side of the planet. And in addition to the gold, there's an equivalent value of silver, copper and other base metals as well as exotic metals like scandium. So, this is a really exceptional depository of metals and there will be a lot more ounces and pounds found in that region over the next couple of years."
Now we will proceed to review the three Golden Triangle stocks that we bought earlier. Note that clicking on the stock name will take you back to the latest/last report on it.
Aben Resources Ltd. (ABN:TSX.V; ABNAF:OTC.MKTS); CA$0.21, $0.165
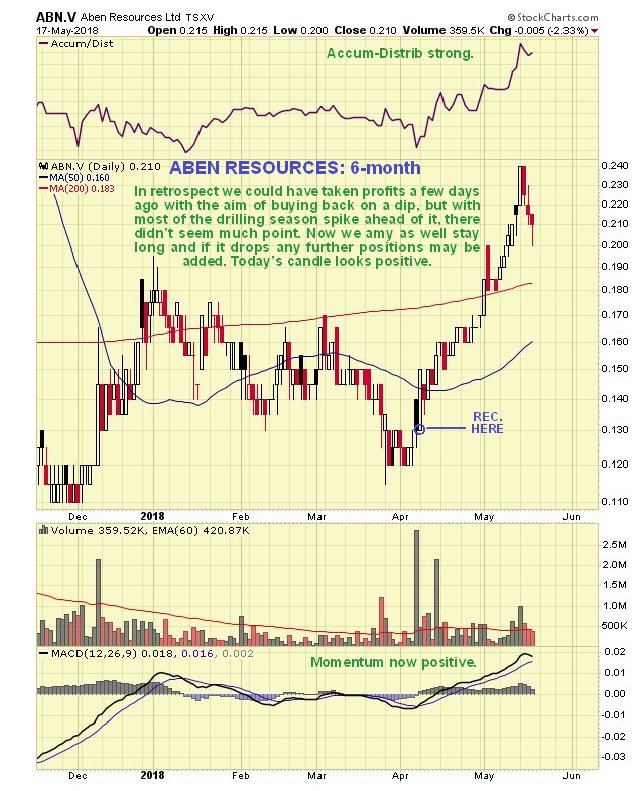
We start with Aben Resources Ltd. (ABN:TSX.V; ABNAF:OTC.MKTS), which we bought at just the right time as its current uptrend started early in April, so even after the correction of recent days it is up 50%, as we can see on its latest 6-month chart below.
image: streetwisereports.com
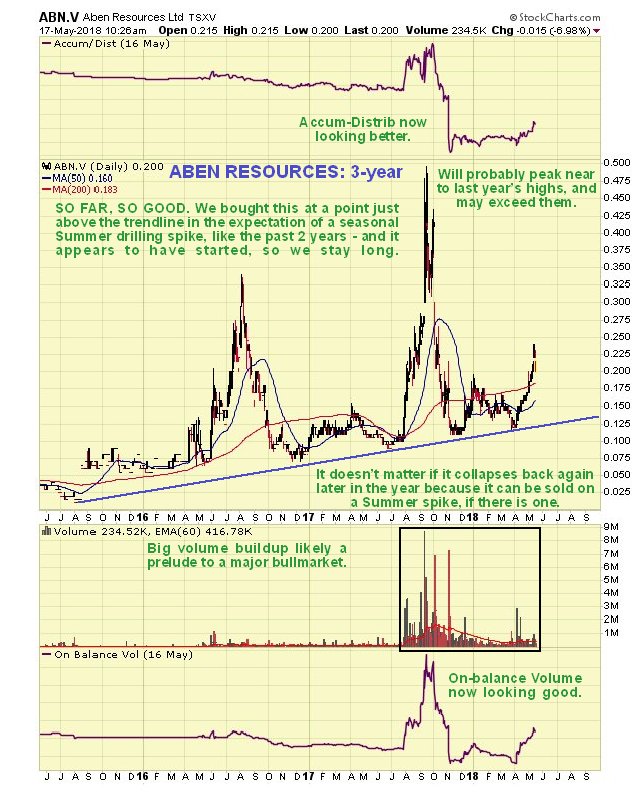
Despite the stock having become overbought some days back, we decided not to sell, but to ride out any minor correction, because it is still early in its drilling season speculative rally, which could see it attain its highs of last year by midsummer and possible exceed them, as we can see on its 3-year chart below.
image: streetwisereports.com
 Aben Resources website. Aben Resources website.
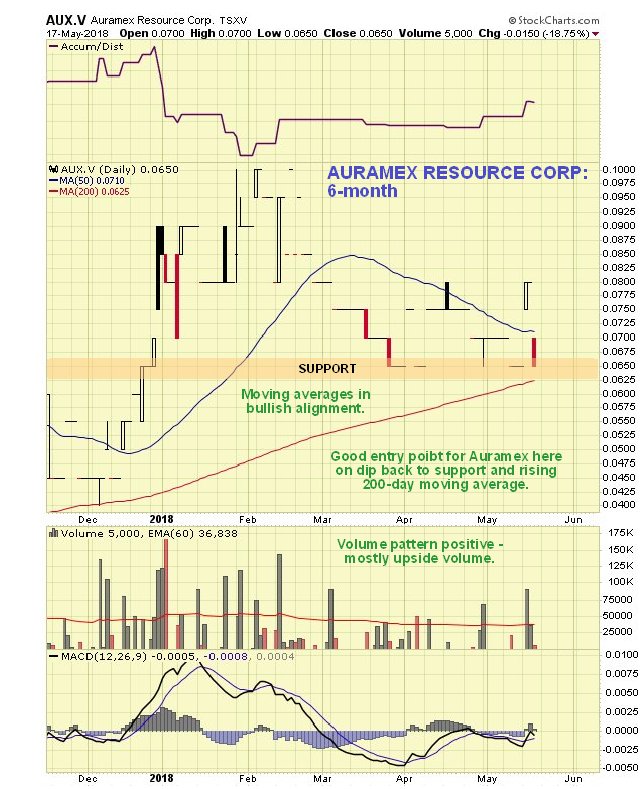
Auramex Resources Corp. (AUX:TSX.V); CA$0.065
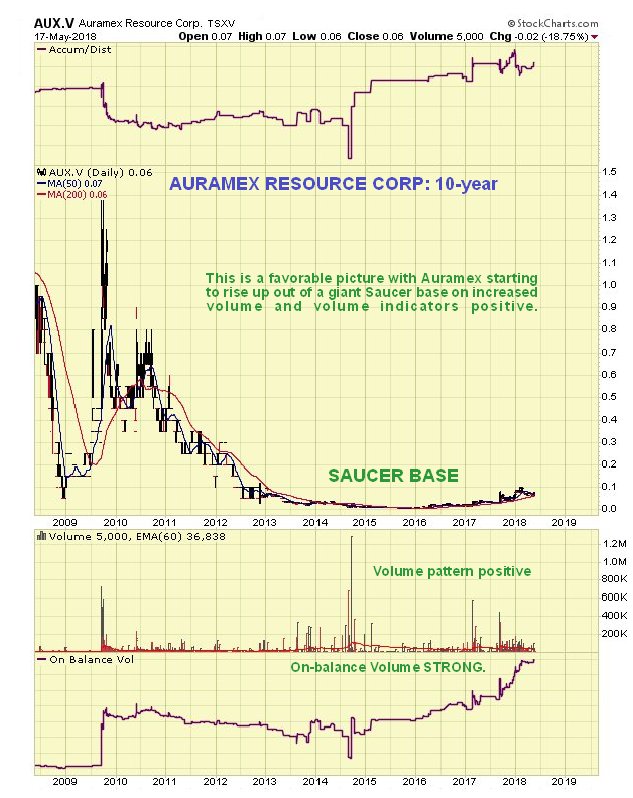
On the 10-year chart for Auramex Resources Corp. (AUX:TSX.V) we can see that it is just started to emerge out of a giant saucer-base pattern, with its volume indicators positive.
image: streetwisereports.com
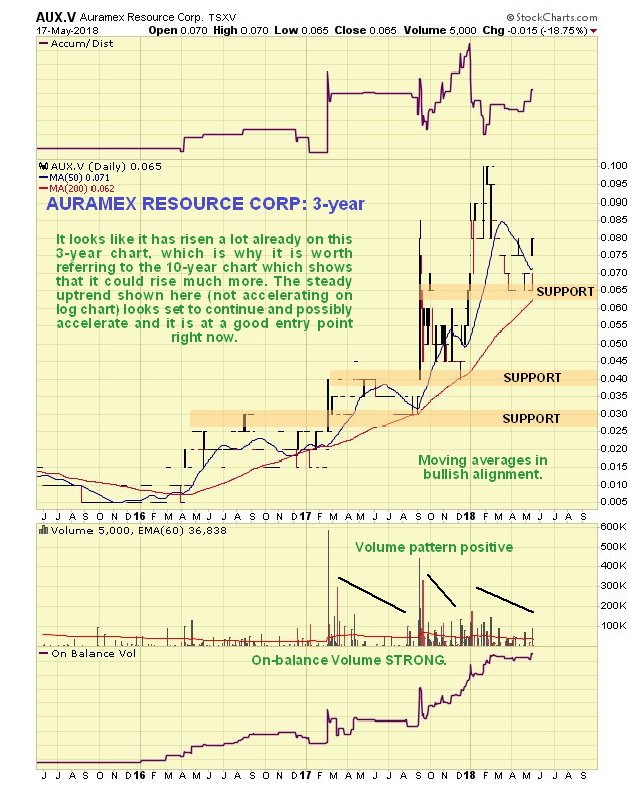
 On the 3-year chart we see that it is in a strong uptrend, and at a good entry point having just reacted back to support near to its rising 200-day moving average. Although it looks like it has risen a lot already on this chart, with the benefit of having looked at the 10-year, we know that it could rise much further yet and could well accelerate. On the 3-year chart we see that it is in a strong uptrend, and at a good entry point having just reacted back to support near to its rising 200-day moving average. Although it looks like it has risen a lot already on this chart, with the benefit of having looked at the 10-year, we know that it could rise much further yet and could well accelerate.
image: streetwisereports.com
 On the 6-month chart we see that we are at a good entry point right now. On the 6-month chart we see that we are at a good entry point right now.
image: clivemaund.com
 Auramex Resource Corp website. Auramex Resource Corp website.
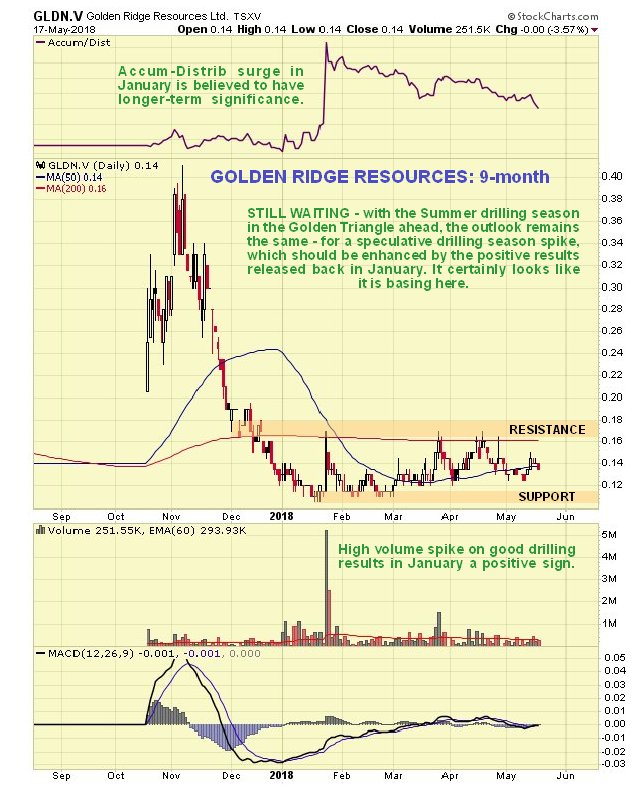
Golden Ridge Resources Ltd. (GLDN:TSX.V); CA$0.14
Next we look at Golden Ridge Resources Ltd. (GLDN:TSX.V), which is at about the same price as when we bought it back in the middle of March. As we can see on its latest 9-month chart it is still basing in a trading range, but as the drilling season gets underway it is likely to do what we expected of it, which is to break out of the trading range and advance, possibly steeply, again probably topping out in midsummer.
image: streetwisereports.com
Golden Ridge Resources website.
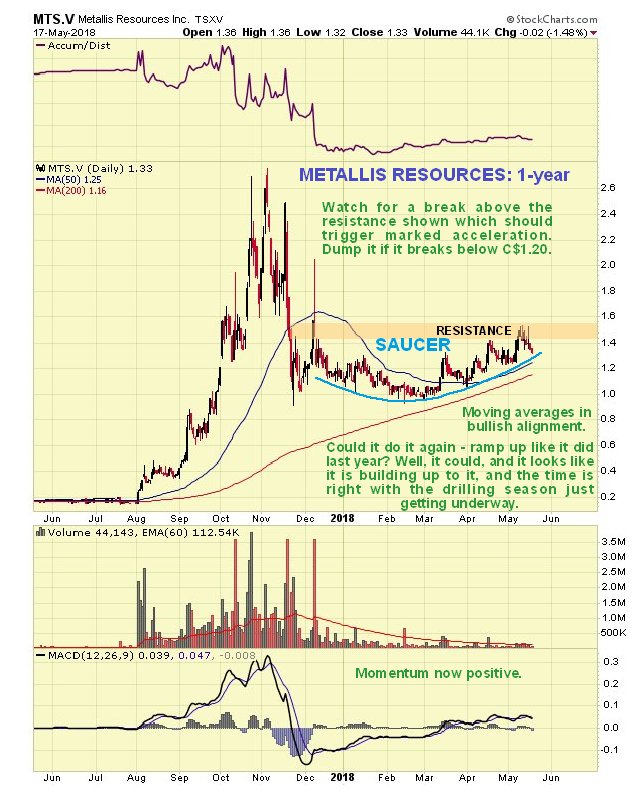
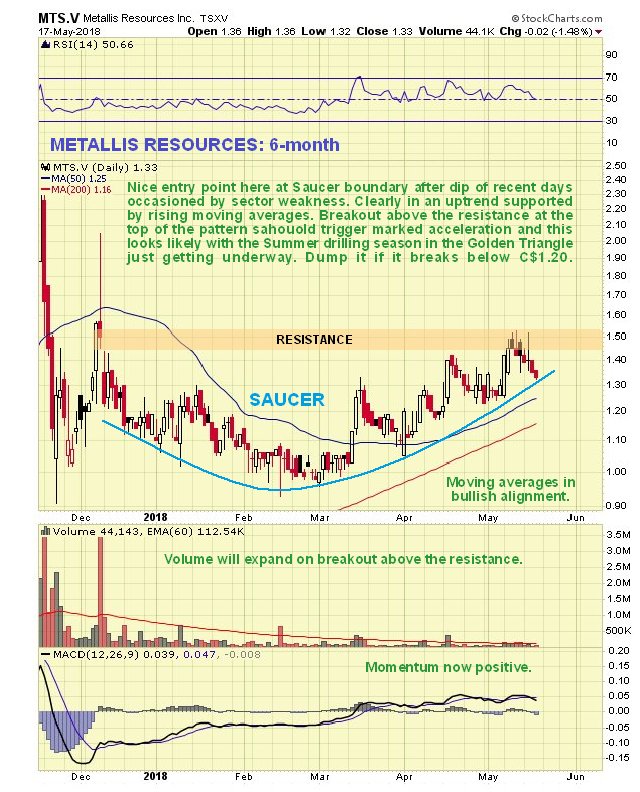
Metallis Resources Inc. (MTS:TSX.V); CA$1.33, $1.03
Metallis Resources Inc. (MTS:TSX.V) staged a summer rally of almost mind-boggling proportions last year, as we see on its 1-year chart. This was followed by an inevitable fall reaction, which was actually rather modest and followed by the formation of a saucer-base pattern, that appears to be completing, as luck would have it, right at the start of a new drilling season. Could we see another big summer ramp? We could—why not? Although since it will begin from a much higher start point we won't and can't see the sort of percentage gains that occurred last year. Nevertheless they could be well worth going for, and after the dip of recent days it is rated a strong speculative buy here.
image: streetwisereports.com
 The 6-month chart shows recent action in more detail, and we can see more clearly the recent uptrend above the saucer boundary, with the bullishly aligned moving averages providing underlying support. Good entry point but a break below the saucer boundary would spoil the pattern. Dump it if it drops below CA$1.20. The stock should break out upside from the saucer imminently. Metallis trades in light but acceptable volumes on the U.S. OTC market. The 6-month chart shows recent action in more detail, and we can see more clearly the recent uptrend above the saucer boundary, with the bullishly aligned moving averages providing underlying support. Good entry point but a break below the saucer boundary would spoil the pattern. Dump it if it drops below CA$1.20. The stock should break out upside from the saucer imminently. Metallis trades in light but acceptable volumes on the U.S. OTC market.
image: streetwisereports.com
Metallis Resources website.
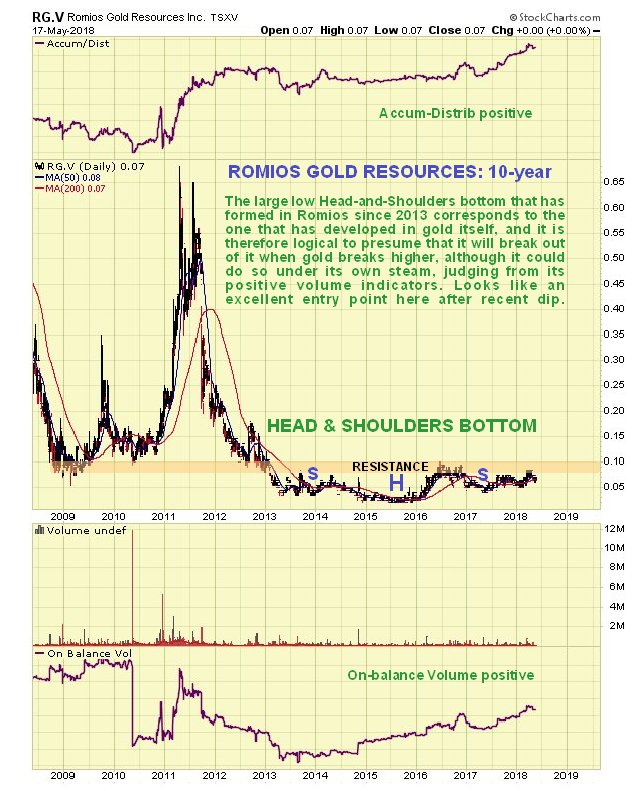
Romios Gold Resources Inc. (RG:TSX.V; RMIOF:NASDAQ; D4R:FSE); CA$0.07, $0.058
On the 10-year chart for Romios Gold Resources Inc. (RG:TSX.V; RMIOF:NASDAQ; D4R:FSE) we can see that a fine large head-and-shoulders bottom is completing that corresponds to the one completing in gold itself, and this chart, with its positive volume indicators, adds weight to our contention that gold is building toward a major upside breakout. We should note, however, that Romios looks set to break out with or without gold's help, with the chances of its doing so being increased by the fact that it is active in the Golden Triangle. This pattern looks mature and complete, so an upside breakout is considered likely to occur soon.
image: streetwisereports.com
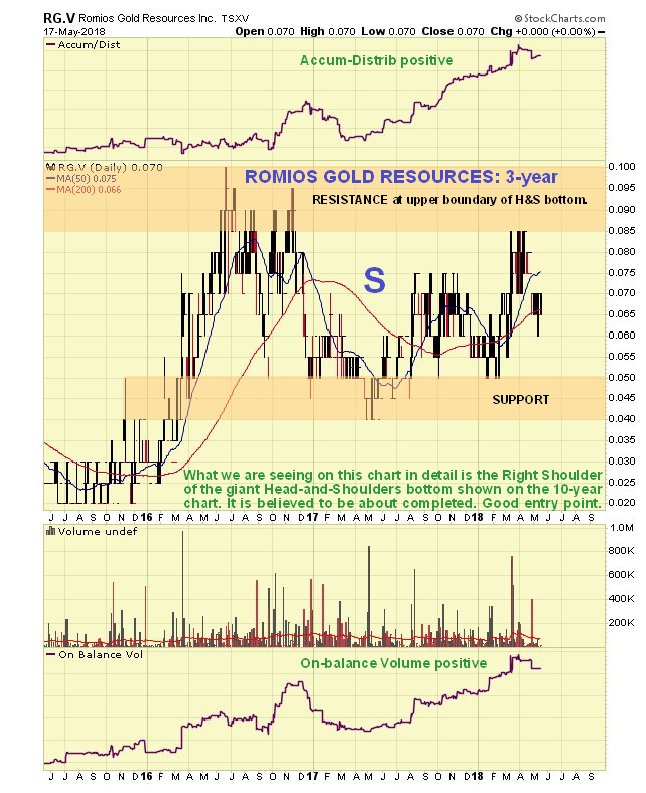
 The 3-year chart for Romios enables us to view the right shoulder of its giant head-and-shoulders bottom pattern in much more detail. With it hauling itself up from the right shoulder low, and still some way below the "neckline" or upper boundary of the giant base pattern, we are believed to be at a good entry point here. The 3-year chart for Romios enables us to view the right shoulder of its giant head-and-shoulders bottom pattern in much more detail. With it hauling itself up from the right shoulder low, and still some way below the "neckline" or upper boundary of the giant base pattern, we are believed to be at a good entry point here.
image: streetwisereports.com
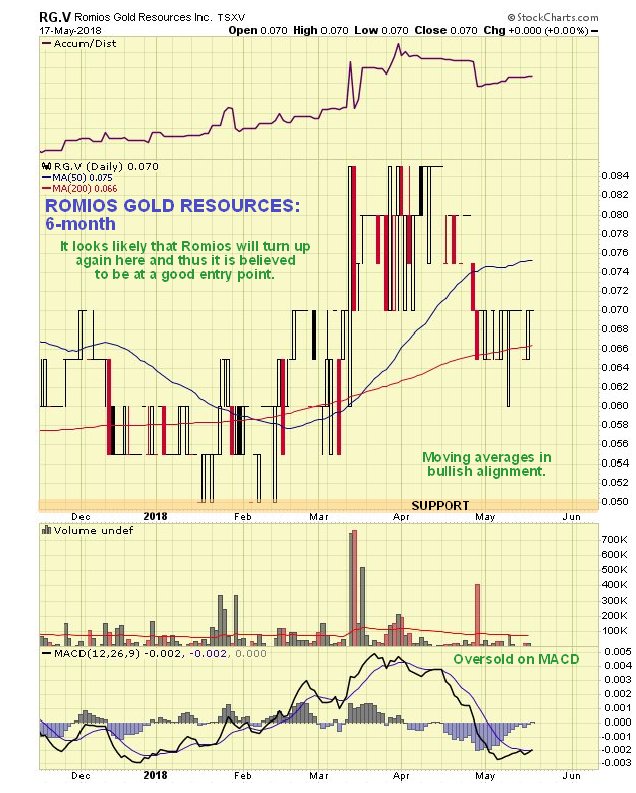
 On the 6-month chart we can see that the recent dip on the back of sector weakness has resulted in its being oversold near to its rising 200-day moving average, so the chances are good that it will turn up again here, thus this looks like a good entry point. Romios trades in generally light volumes on the U.S. OTC market. On the 6-month chart we can see that the recent dip on the back of sector weakness has resulted in its being oversold near to its rising 200-day moving average, so the chances are good that it will turn up again here, thus this looks like a good entry point. Romios trades in generally light volumes on the U.S. OTC market.
image: streetwisereports.com
 Romios Gold Resources website. Romios Gold Resources website.
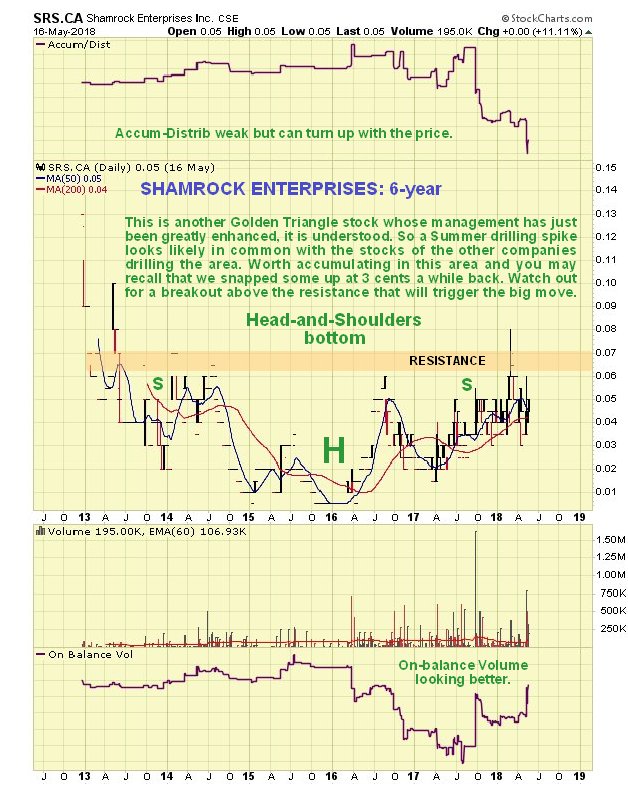
Shamrock Enterprises Inc. (SRS:CSE); CA$0.05
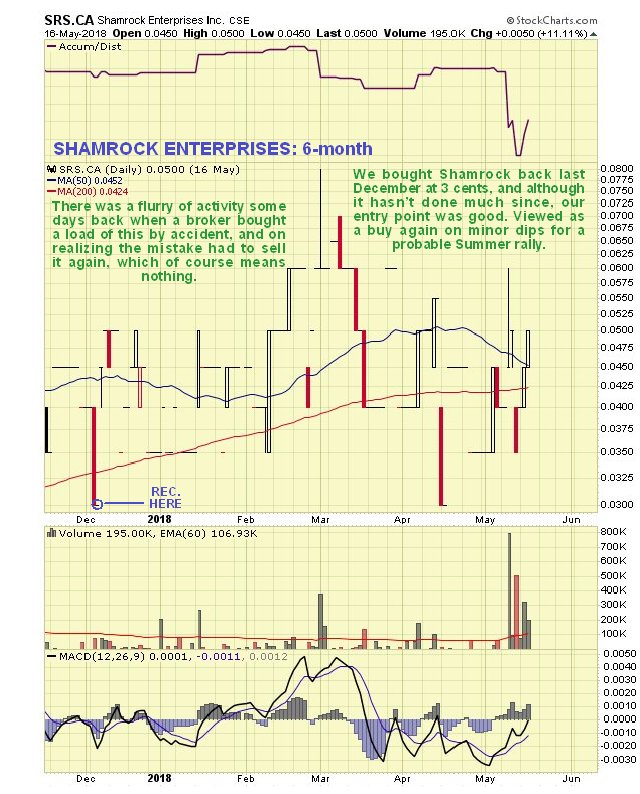
Shamrock Enterprises Inc. (SRS:CSE) is an extremely cheap Golden Triangle play that we scooped up at just $0.03 or a little above back in December, since which time it has basically done nothing, although its average price has since been higher, as we can see on its 6-month chart below. The news here is that they have beefed up their management and they are understood to also have a summer drilling program in place. There was a rather amusing episode last week where a broker accidentally bought 800,000 shares, probably by hitting the wrong button or inputting the wrong code, and then had to sell them again, hence the flurry of activity that is obviously meaningless.
image: streetwisereports.com
 The long-term 6-year chart for Shamrock looks very promising indeed, with a large head-and-shoulders bottom completing. There is a clear band of resistance at the upper boundary of this pattern, and should the price break above it, it will likely spike, and with the summer drilling season at hand, that could happen soon. So we stay long and it is a speculative buy on minor dips ahead of the breakout. The long-term 6-year chart for Shamrock looks very promising indeed, with a large head-and-shoulders bottom completing. There is a clear band of resistance at the upper boundary of this pattern, and should the price break above it, it will likely spike, and with the summer drilling season at hand, that could happen soon. So we stay long and it is a speculative buy on minor dips ahead of the breakout.
image: streetwisereports.com
Shamrock Enterprises website
Read more at stockhouse.com |


