SI
SI
discoversearch

We've detected that you're using an ad content blocking browser plug-in or feature. Ads provide a critical source of revenue to the continued operation of Silicon Investor.  We ask that you disable ad blocking while on Silicon Investor in the best interests of our community.  If you are not using an ad blocker but are still receiving this message, make sure your browser's tracking protection is set to the 'standard' level.
Strategies & Market Trends : Underexposed Canadian Stocks

 Public ReplyPrvt ReplyMark as Last ReadFilePrevious 10Next 10PreviousNext  
To: Underexposed who wrote (45)6/11/2018 5:18:00 PM
From: Underexposed  Read Replies (1) of 65
 
Ok, now we have some money to add to our portfolio in the form of one or maybe two new stocks. I have selected 4 to choose from. It will depend on how they pass my TA .

The one we will look at today is Atrium Mortgage Investment Corporation [TSX:AI]

Here is a description of the company:

Atrium Mortgage Investment Corp is a non-banking finance company providing residential and commercial mortgages that lends in major urban centers in Canada where the stability and liquidity of real estate are high.

The share price currently is $12.82

The dividend yield is 6.998% with a monthly payout of $0.075/month

Well the price is decent and I do like monthly income so let us see my limited Financial assessment

Atrium Mortgage financials

Balance Sheet (quarterly)

Short term debt : none
Long term debt: stable in the range of $248 - 270 million over the last 5 years

Income Statement (quarterly)

Interest income after provision for loan loss : Very consistent at about $9million except for Dec17 when the amount was $17.5 million

Net Income: Stable at about $7.9 Million

There are n red flags in the FA for me

Technical analysis

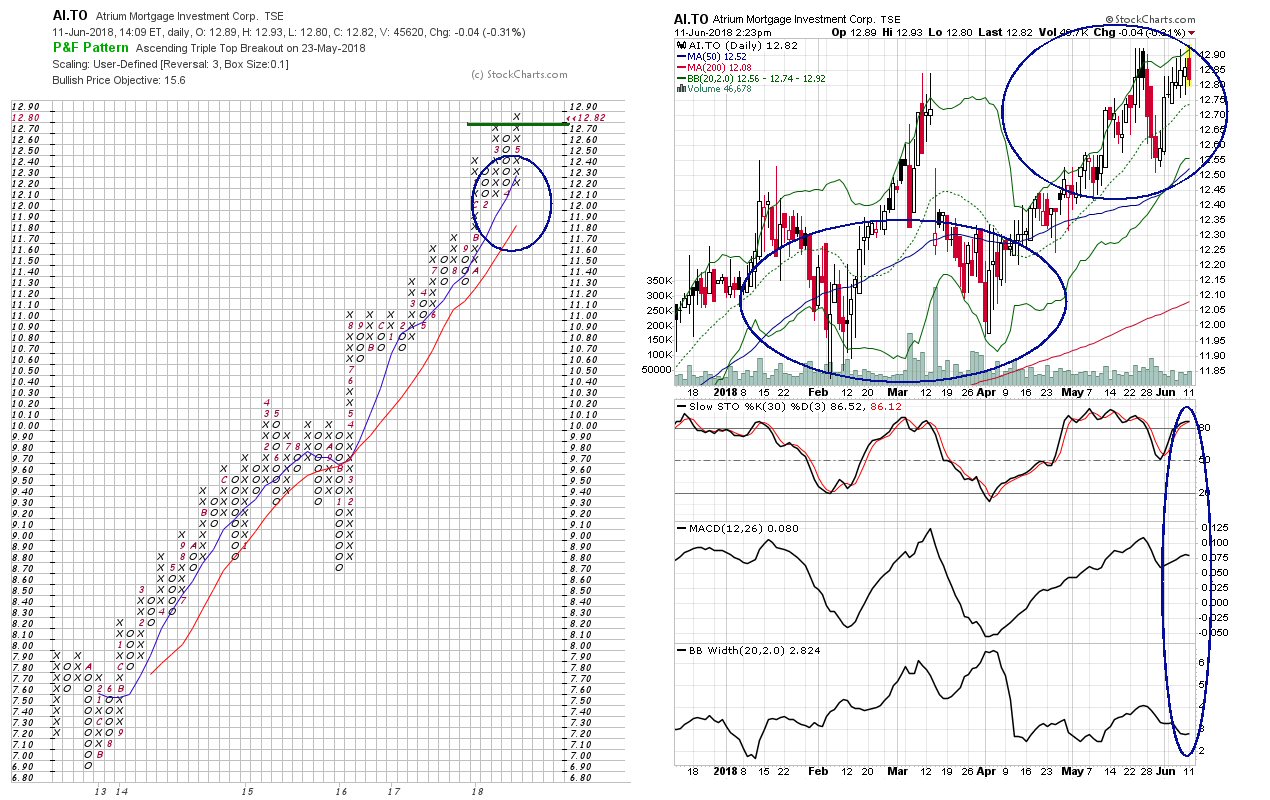
P&F and Trigger charts


The P&F chart shows a 5 year rise with only one serious short term decline in Jan/16.

Currently there is a breakout over a resistance (now a support) bullish

the Column SMA are bullish and have been for those 5 years bullish

The Trigger chart shows a more broken up pattern

Currently I like the fact that for the past several months that the share price has been tracking the upper bollie. However, those plummets in Feb and March with little or no warning bothers me and after a prolonged rise I wonder ... was that drop in early June the same as the other 2 or was it a prelude to things to come mildly bearish

The indicators cannot really be evaluated since the BBWidth has not settled yet. There is a mild bullishness overall at this point, but then I look at the days before those previous plummets and see a similar formation so I think this is mildly bearish.

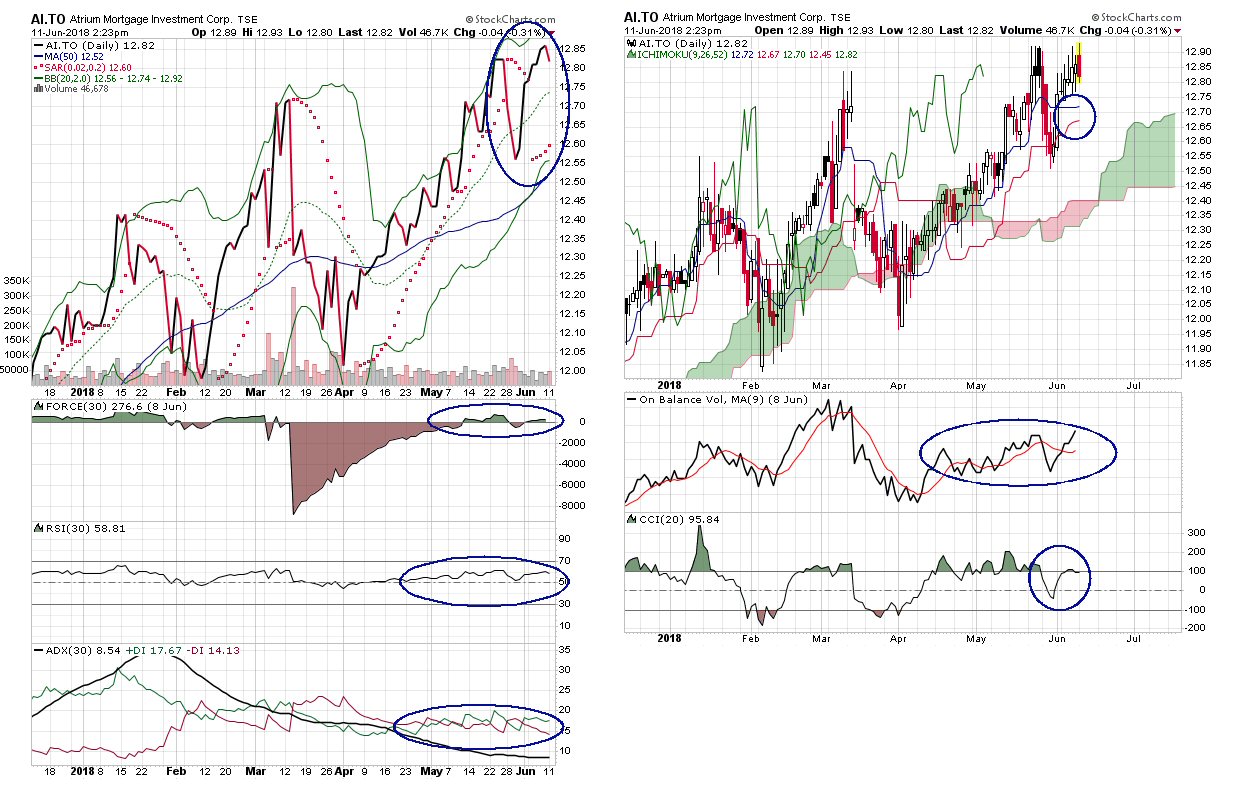
Sentiment and Ichimoku charts


in the sentiment chart, at the top of that blue circle. Do you see that green wavy line? That is the upper bollie. Now ... look at the upper bollie at the peak in March...it looks pretty similar to me..a warning?

The Par Sar looks bullish right now but I really trust this overlay when it strikes the share price in a Bollie squeeze so it is only mildly bullish to me

The Force 30 cannot make up its mind Neutral

The RSI(30) has a slight positive slope and is over 50 mildly bullish

The DI+/- shows a lot of indecision, currently it is showing a bit of bull... but not a lot... neutral bullish

The Ichimoku chart is decent but not overwhelming to me. I like progressive up and down chart tendencies but this one looks like a lie detector chart...all scribbles

It is good that the share price is high above the green cloud... however if you look at the other peaks the same was true but this did not stop the price from crashing into those clouds mildly bearish

the thin red/blue lines are bullish but converging so that takes some of the bull out of it mildly bullish

the On Bal volume is neutral bullish

The CCI is bullish

Conclusion

The financials are ok... very stable debt and income.... it is almost too stable I don't see a lot of growth over the past 5 years

Let's do the bull/bear comparison

Bullish:.................. 3
Mildly Bullish:....... 3
Neutral Bullish:.... 2
Neutral:................ 1
Neutral Bearish:
Mildly Bearish:.... 3
Bearish:

Bullish:.................. 3
Mildly Bullish:.......
Neutral Bullish:.... 2
Neutral:................ 1
Neutral Bearish:
Mildly Bearish:....
Bearish:

We are definitely on the bullish side in the analysis... but I do have reservations about this stock right now. we shall see how the other 3 look.

Tomorrow I will do BCE inc. @ about $50.00/share.... an expensive sucker :)

UE
Report TOU ViolationShare This Post
 Public ReplyPrvt ReplyMark as Last ReadFilePrevious 10Next 10PreviousNext