SI
SI
discoversearch

We've detected that you're using an ad content blocking browser plug-in or feature. Ads provide a critical source of revenue to the continued operation of Silicon Investor.  We ask that you disable ad blocking while on Silicon Investor in the best interests of our community.  If you are not using an ad blocker but are still receiving this message, make sure your browser's tracking protection is set to the 'standard' level.
Strategies & Market Trends : Underexposed Canadian Stocks

 Public ReplyPrvt ReplyMark as Last ReadFilePrevious 10Next 10PreviousNext  
To: Underexposed who wrote (46)6/12/2018 12:57:14 PM
From: Underexposed  Read Replies (1) of 65
 
Today we are looking at a relatively expensive stock - BCE.Inc [TSX:BCE]

Here is a description of the company:

BCE Inc is a telecommunication company. It caters to residential, business and wholesale customers with solutions for all their communications needs.

The share price currently is $55.23

The dividend yield is 5.479% with a monthly payout of $0.755/quarter

This is a decent dividend but it is so expensive that we could only get about 390 shares at this price and the amount of cash that we currently have... but those shares will give a $300 dividend every 3 months.

BCE financial reports

Balance Sheet (annual)

Short term debt : rising slightly to about $5 Billion
Long term debt: rising slightly to about $18 Billion over the last 5 years

Income Statement (annual)

Total Revenue : Very consistent at about $21 Billion

Net Income: Stable at about $2.9 Billion

There are no red flags in the FA for me... high debt but has the revenue to cover it I think

Technical analysis

P&F and Trigger charts


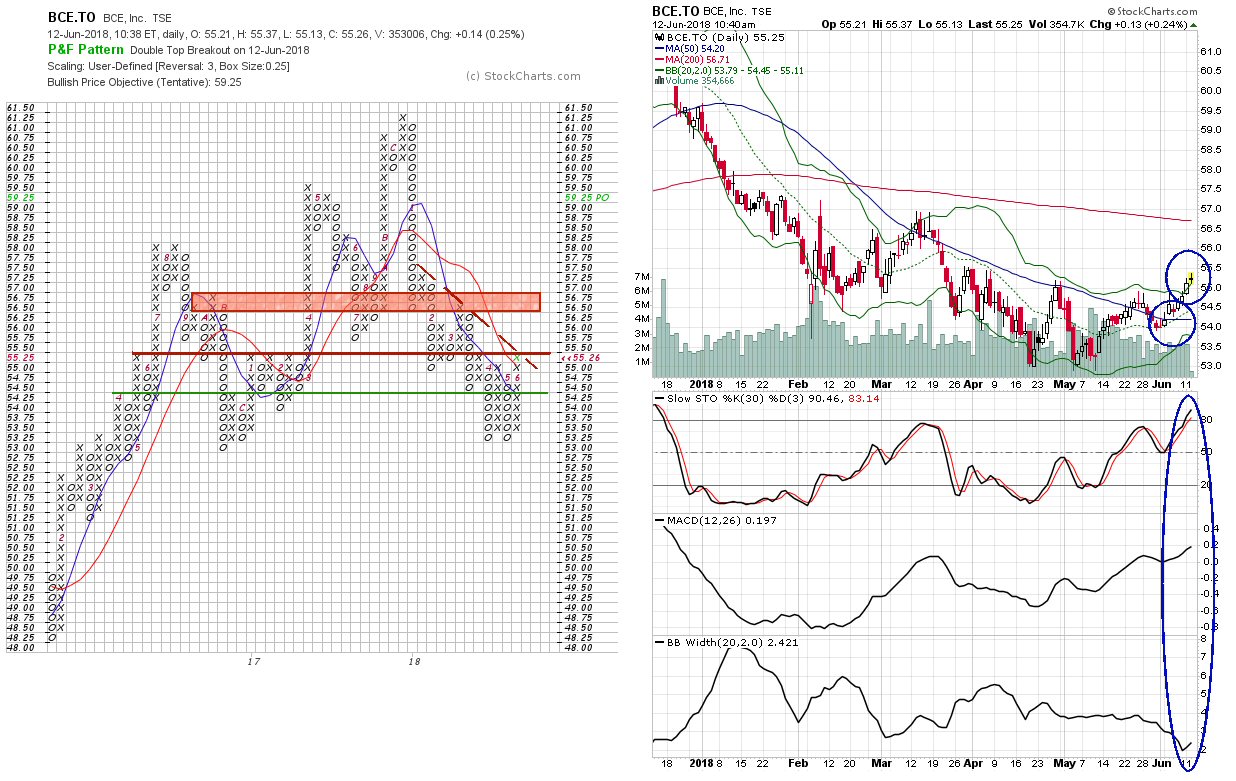
The P&F chart is not bullish as it may seem with a Double Top breakout. That dashed red line is a diagonal resistance at $55.50 which reinforces the horizontal resistance . then if that is passed it runs smack into a resistance band from $56.50 - $57.00 mildly bearish

the column SMA's have not reversed and does not show a sign of it happening yet. bearish

Well that is the really bad news... it gets better thankfully.

In the Trigger chart we see by the indicators that we have a buy signal right now.. bullish
The share price is nicely tracking the upper bollie... bullish
The 20daySMA has crossed the 50daySMA...bullish

Sentiment and Ichimoku charts


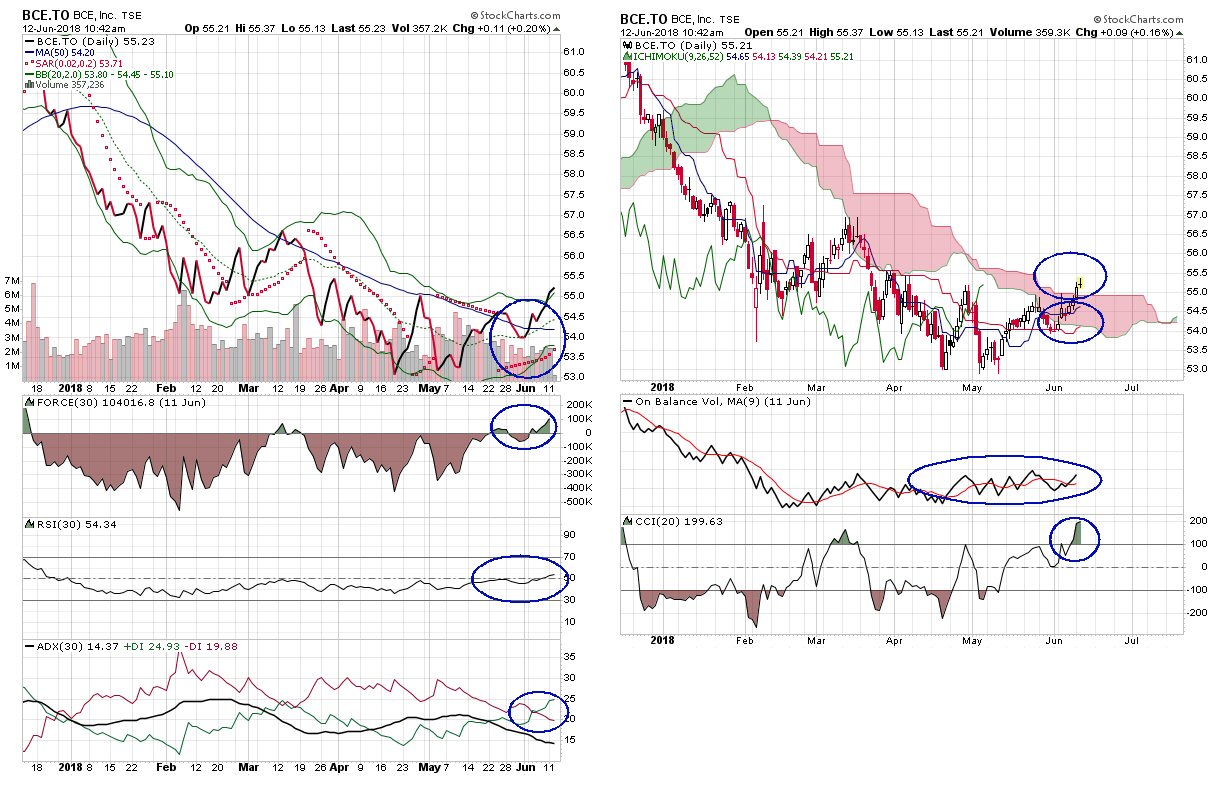
In the Sentiment chart shows a Par Sar that looks pretty good however I don't get excited unless that reversal takes place in the throat of a bollie squeeze... mildly bullish

the Force 30 has pulled itself out of the mud and has a nice slope ... bullish

the RSI(30) is pretty much flat with a positive drift now ... neutral bullish

the DI+/- shows a recent bullish cross that is diverging

the Ichimoku chart looks very good.
The share price has burst from a red cloud... bullish
The thin blue/red lines are bullish and diverging ... bullish
The onBal Vol is flat ... neutral
The CCI is bullish

Conclusion

The financials are ok... very stable debt and income.... I think it is pulling out a dive finally

Let's do the bull/bear comparison

Bullish:.................. 8
Mildly Bullish:....... 1
Neutral Bullish:.... 1
Neutral:................ 1
Neutral Bearish:
Mildly Bearish:.... 1
Bearish:............... 1

Bullish:.................. 7
Mildly Bullish:.......
Neutral Bullish:.... 1
Neutral:................ 1
Neutral Bearish:
Mildly Bearish:....
Bearish:..............

Clearly this stock is quite bullish.

The fly in the ointment is the P&F chart that shows many hurdles in the future. Overall not a bad choice

Tomorrow I will look at Brookfield Real Estate Services Inc. [TSA:BRE]

UE
Report TOU ViolationShare This Post
 Public ReplyPrvt ReplyMark as Last ReadFilePrevious 10Next 10PreviousNext