SI
SI
discoversearch

We've detected that you're using an ad content blocking browser plug-in or feature. Ads provide a critical source of revenue to the continued operation of Silicon Investor.  We ask that you disable ad blocking while on Silicon Investor in the best interests of our community.  If you are not using an ad blocker but are still receiving this message, make sure your browser's tracking protection is set to the 'standard' level.
Strategies & Market Trends : Underexposed Canadian Stocks

 Public ReplyPrvt ReplyMark as Last ReadFilePrevious 10Next 10PreviousNext  
To: Underexposed who wrote (47)6/13/2018 11:54:35 AM
From: Underexposed  Read Replies (1) of 65
 
The next candidate to investigate is Brookfield Real Estate Services Inc. [TSX:BRE]

Here is a description of the company:

Brookfield Real Estate Services Inc is a Canada-based real estate services company. Its segment includes providing information and services to real estate agents and brokers in Canada through a portfolio of real estate services brands.

The share price currently is $17.89

The dividend yield is 7.548% with a monthly payout of $0.113/monthly

This is a larger dividend yield with a lesser share price so we could only get about a $158.00 dividend every month. This is not chum change.

BRE Financials

Balance Sheet (annual)

Short term debt : there is no mention of a short term debt
Long term debt:is pretty stable around $60 million which seems low to me, but that depends on revenues

Income Statement (annual)

Total Revenue : Very consistent at about $40million

Net Income: net income has doubled last year to $12 million... not bad

There are no red flags in the FA for me... I like the doubling of Net Income last year with a relatively constant Total Revenue

Technical analysis

P&F and Trigger charts


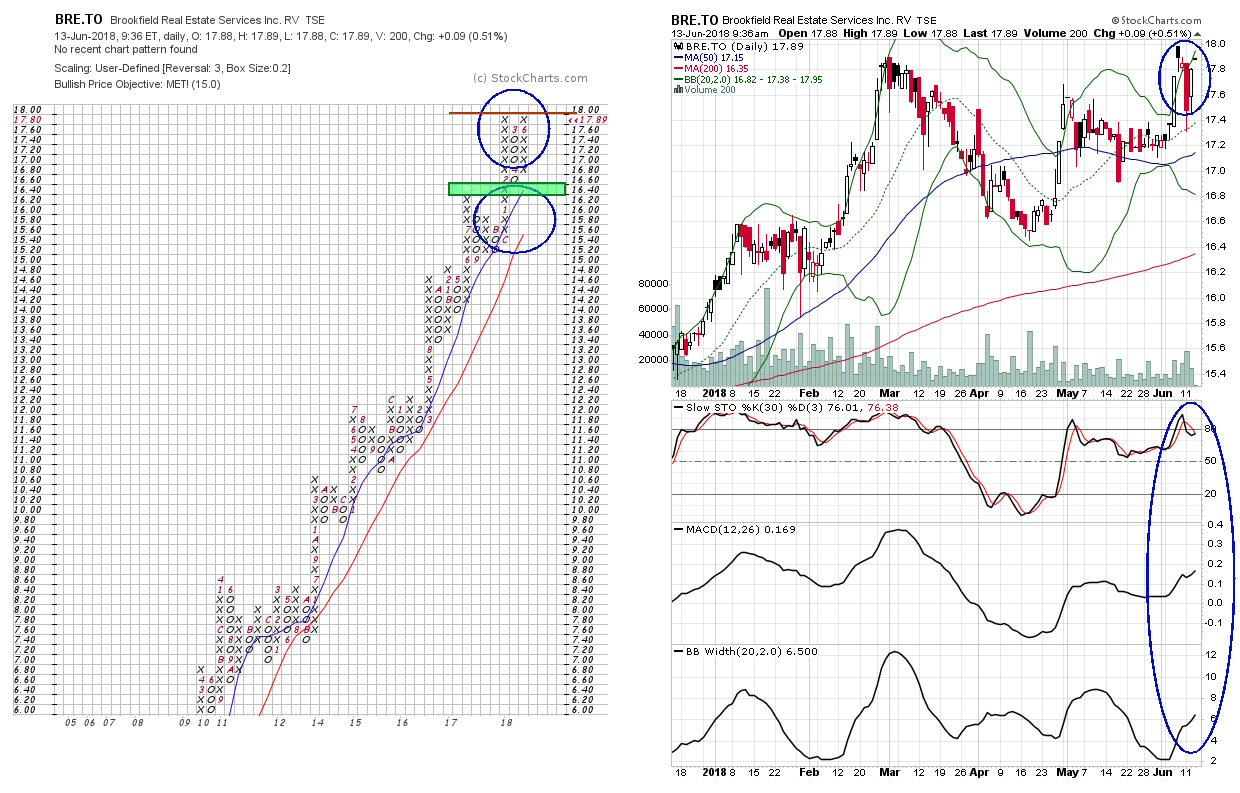
The P&F chart certainly demonstrates that this stock has been a great long term investment. Just think of the dividends if you were in a tax sheltered stock for 10 years.

The share price is knocking the door of a highest share price ever mildly bullish ... only mild so far since the resistance at $18.00 has not been breached and closed yet.

I like the column SMA lines... bullish for 10+ years

In the Trigger chart it is a bit complicated. In the upper circle you see how the share price broke out of the bollie squeeze like a rocket... above the upper bollie... and as I have said many times, there is a pullback which happened 4 days later and it was a big one... that could have been bad new but it recovered the next day and now we are again attacking the resistance we showed earlier ... bullish

You also see the renewed push in the indicators below.

Sentiment and Ichimoku charts


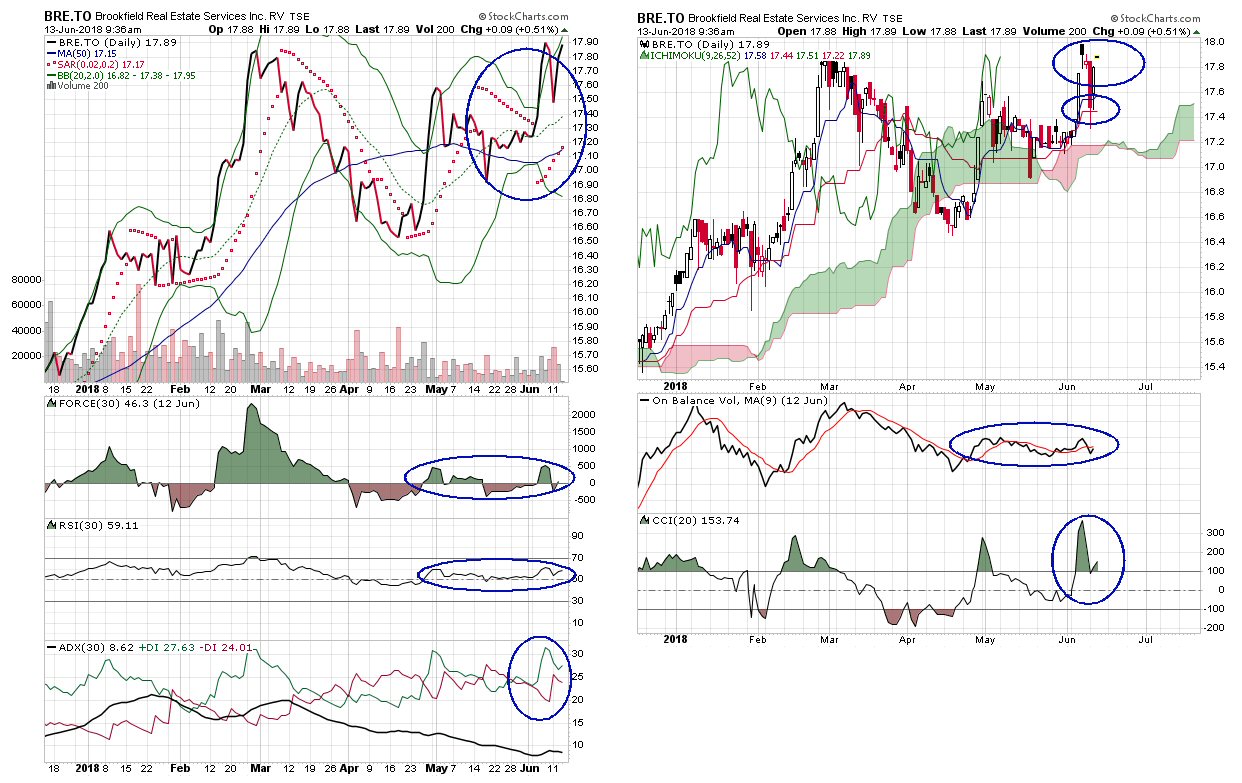
In the Sentiment chart, this is the Par Sar that I like... see how it hits the share price in the throat of the Bollie Squeeze? bullish

The Force 30 is showing indecision... neutral
The RSI 30 is flat but on the bullish side ... neutral bullish
The DI+/- it has broken out from an indecision but is currently mildly bullish

The Ichimoku chart is pretty good

The share price is high above the clouds ... bullish
The thin red/blue lines are bullish and diverging ...bullish

the on bal volume is flat... neutral
the CCI is bullish.

Conclusion

Let's do the bull/bear comparison

Bullish:.................. 6
Mildly Bullish:....... 2
Neutral Bullish:.... 1
Neutral:................ 2
Neutral Bearish:
Mildly Bearish:....
Bearish:...............

This stock does not show any bearish signs. I like the price and I like the dividend.

This stock is the best so far

UE
Report TOU ViolationShare This Post
 Public ReplyPrvt ReplyMark as Last ReadFilePrevious 10Next 10PreviousNext