They are manipulaing the data!!
And, by they, of course I mean Spencer and Christy.
Global warming is in the air, in the UAH lower troposphere
Sou | 2:16 PM

The UAH data for October is out. John Christy and Roy Spencer from the University of Arizona Huntsville have a contract with NOAA to analyse temperature changes in the atmosphere. Each month they publish the latest data.
Deniers dislike it less than other data sets, especially since John and Roy revised the latest version considerably downwards, making their data an anomaly!
I came across a chart I prepared a few years ago and thought I'd do it over again using the latest UAH data.
Here is the result:
 | | Figure 1 | Illustration of the trend in lower tropospheric temperature as reported by UAH. Data source: UAH |
I hope you enjoyed that, and maybe your sceptical acquaintances (you have some, I expect), will learn something from it :)
Deluded deniers at WUWTJust so you know I'm not exaggerating when I say deniers like UAH best, and/or there are those who think this is "nearly flat", here are some quotes from Anthony Watts' WUWT, a climate conspiracy blog.
Alan Tomalty thinks UAH is the "only database that counts"
November 4, 2018 at 1:25 pm
The only database that counts is the UAH one. When the data temp goes back down to equal the level in 1979 at one of the coldest periods, that will be the last nail in the coffin of the CO2 scam. At that point Nick will keep swearing that you cant trust the UAH data, but everyone else will know the game is over. Unfortunately this might not happen for 10 years.
John Tillman wrote down a whole lot of numbers and then finished up by suggesting global cooling has set in. What a drongo!
November 3, 2018 at 6:00 pm
...The Super El Nino spike over, the Plateau has returned, if not indeed global cooling. The same anomaly as 12 years ago and well below 1998.
Phoenix44 is definitely not a math whizz and can't tell straight from up. UAH temperatures are shown as an anomaly from the 1981 to 2010 average. That is, the average temperature for the thirty years from 1981 to 2010 is taken as zero. In earlier years more of the anomalies were below zero, in later years more were above it. If as she (or he) says the "average of the numbers is 0.22" then there would most obviously have to have been a very large increase in recent years! (The "average of the numbers" over the entire period is actually 0.04 °C for monthly, and 0.06 °C for annual.)
November 4, 2018 at 3:05 am
Rubbish. The data is clearly and obviously trendless. There are only three years warmer than the start point, and two of those only by tiny amounts. There are far more years that decrease from the starting point and by more than the highest increase. How can you have an increasing trend when there is literally no increase?
Just look at the data rather than run a line-fit. The average of the numbers us 0.22!
There were big downward adjustments to UAH when it started getting hotterFor those who want to quibble about what I wrote about the downward shift of UAH, and how it makes it an anomaly among datasets, consider this. The latest version (v6) shifts the trend down, with much lower temperature anomalies in the later years as shown by the grey bars.
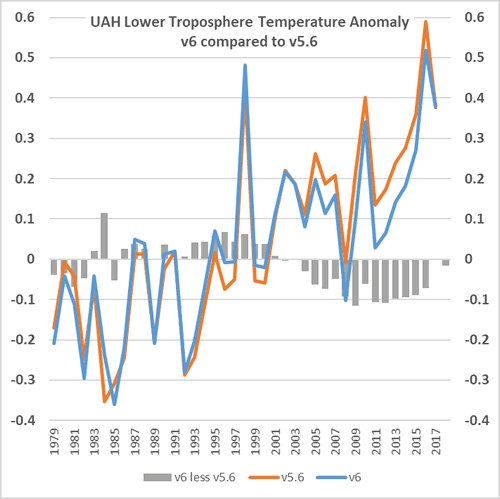 | | Figure 2 | Comparison of the two most recent versions of lower tropospheric temperature as reported by UAH. Data source: UAH |
There is another important dataset of the lower troposphere, prepared by Carl Mears of Remote Sensing Systems (RSS), an independent group. He released a new dataset recently, too. Here is a similar chart showing the difference between v3 and v4. The difference between versions is considerably less than for UAH, with some of the adjustments in the opposite direction.
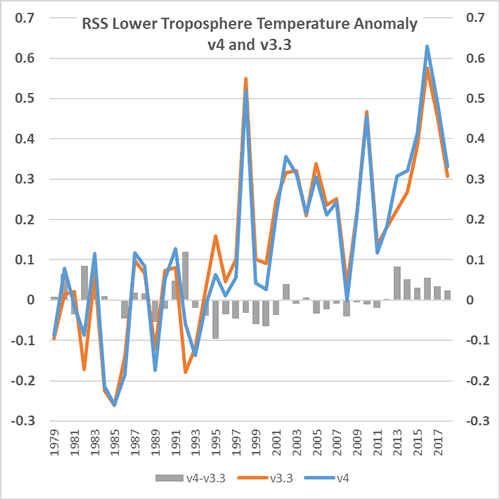 | | Figure 3 | Comparison of the two most recent versions of lower tropospheric temperature as reported by RSS. Data source: RSS |
The magnitude of the average annual difference between versions is much greater for UAH:
UAH v6 minus v5.6: -0.016 °CRSS v4 minus v3.3: +0.0005 °CThe research teams both gave their reasons for adjusting the way they calculate tropospheric temperature. I wrote about the change in TTT (troposphere) for RSS some time ago. (See the references and further reading section below for other relevant papers.)
So there you have it.
blog.hotwhopper.com |


