"'The Chill of Solar Minimum' from September 2018." appears to have ended.
Friday, November 16, 2018
GISS October global up 0.25°C from September.
The GISS land/ocean temperature anomaly rose 0.29°C last month. The October anomaly average was 0.99°C, up from September 0.74°C. A big rise, exceeding the TempLS rise of 0.166°C. Like TempLS it was the second warmest October in the record, but it was even fairly close to the highest, the the El Nino value 0f 1.08 in 2015. Jim Hansen's report is here.
The overall pattern was similar to that in TempLS. Very warm in Siberia, but extending through the Arctic (which is probably why warmer than TempLS). Cold in Canada and US prairies. Quite warm in Europe, patchy in Antarctica.
As usual here, I will compare the GISS and previous TempLS plots below the jump.
Here is GISS

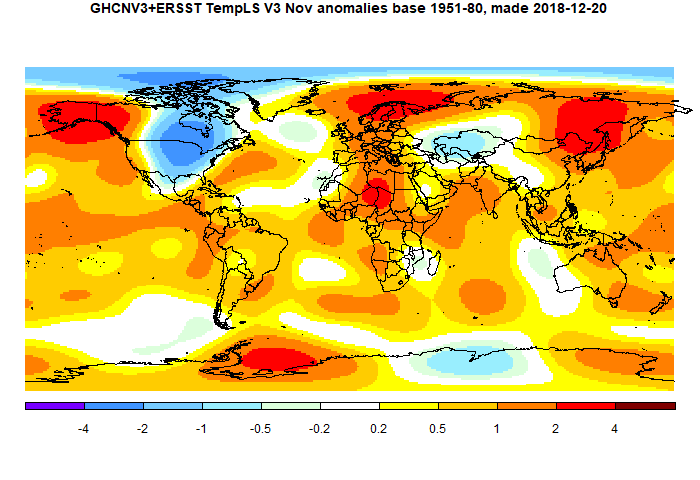
And here is the TempLS spherical harmonics plot
This post is part of a series that has now run for six years. The GISS data completes the month cycle, and is compared with the TempLS result and map. GISS lists its reports here, and I post the monthly averages here.
The TempLS mesh data is reported here, and the recent history of monthly readings is here. Unadjusted GHCN is normally used, but if you click the TempLS button there, it will show data with adjusted, and also with different integration methods. There is an interactive graph using 1981-2010 base period here which you can use to show different periods, or compare with other indices. There is a general guide to TempLS here.
The reporting cycle starts with a report of the daily reanalysis index on about the 4th of the month. The next post is this, the TempLS report, usually about the 8th. Then when the GISS result comes out, usually about the 15th, I discuss it and compare with TempLS. The TempLS graph uses a spherical harmonics to the TempLS mesh residuals; the residuals are displayed more directly using a triangular grid in a better resolved WebGL plot here.
A list of earlier monthly reports of each series in date order is here:
NCEP/NCAR Reanalysis report TempLS report GISS report and comparison with TempLS
moyhu.blogspot.com |


