Sea Level Acceleration Denial
Posted on October 14, 2019 |
Dave Burton, you still don’t understand.
You finally commented on this post, showing a graph of San Diego data and saying:
As you can see, there’ve been >112 years of continuous measurements, and still no detectable acceleration.
Not true. I detected acceleration. You don’t believe it. Then you gave us this:
To the eye the trend looks straight as an arrow. As any engineer could tell you, that means there’s been no practically significant acceleration.
“To the eye”? How many times do I have to repeat that “the eye” is a great tool for getting ideas and clues (one of the best there is) but cannot be relied on for significant conclusions? For that, we use math. It’s hard to believe you would say something so foolish, but it’s finally starting to dawn on me: this really is how you think. You think your eye is better evidence than my math. As for “any engineer” concluding there’s “no practically significant acceleration” — you just made that up. It’s bullshit.
Let’s get to the heart of the matter:
Linear regression finds a linear trend of 2.176 ±0.184 mm/yr, and quadratic regression finds an acceleration of 0.00879 ±0.01259 mm/yr², which is neither statistically nor practically significant.
This is the only evidence you have. The rest of your arguments are nonsense or irrelevant or both. I guess this is why you are so convinced there is no acceleration in this series. The only statitistical test you have reported, apparently the only one you are able to apply, is to fit a quadratic. Not all trends with acceleration resemble a parabola, especially in sea level time series. For many a quadratic fit is a weak test. Many.
I’ve already told you that. I’ve said it often. How many times do I have to repeat this? How often must I repeat it before you even acknowledges its existence? I’ve said this often enough that you have no excuse for not being aware of it. Yet here, again, you don’t seem able to do anything else, but talk about it as though it gives the “final answer.”
I didn’t conclude “acceleration” based on fitting a parabola. I didn’t do so based on the lowess smooth (but it’s a great way to show what’s really going on). Conclusions were based on changepoint analysis of a piecewise linear model: two straight lines joined at their endpoints. This is a more realistic model for sea level trends than a parabola. When I applied it to the data from San Diego since 1950, the p-value was 0.017. That’s statistically significant.
You don’t seem to like my starting at 1950, so I ran the same test using the whole time span of data from San Diego. Now the p-value is < 0.004. That's even more statistically significant.

Those are the numbers, Dave. I didn’t make ’em up, I calculated them. They are “statistically significant.” Not just for San Diego, not just for Key West and Boston and St. Petersburg. For LOTS of tide gauge stations. This whole thing started with your statement that many stations show acceleration early but not after the late 1920s. The data contradict you; there are SO MANY that do, your claim isn’t just wrong it’s ludicrous. It’s truly idiotic.
What they don’t show, is response to your “fit a quadratic to the whole thing” test. I’ve told you repeatedly that for finding acceleration in tide gauge data (after the “late 1920s” or not) that’s a weak test. I wasn’t kidding. It really is. The model behind it is that the signal shows constant acceleration, i.e. the acceleration remains exactly the same throughout the entire time span. That particular idea is so clearly contradicted by data — by individual tide gauges, by reconstructions of global sea level, and by satellite data — that to use it as your one and only criterion for detecting acceleration is a dreadful mistake.
In fact given what we do know about sea level — that it has shown all kinds of acceleration over the last century+ including deceleration in the early 1900s and acceleration lately — the “fit a quadratic to the whole thing” test is just about the weakest choice available. If that was your intent, congratulations.
Other methods perform better. I’m not kidding, they really do. The changepoint analysis I used is one of them. For San Diego data, it says “statistically significant.” That’s just a fact, whether you like it or not.
You have not faced this fact. You have ignored this fact. You have been told, multiple times. You can no longer ignore the results I got from changepoint anaysis. Either accept them, or explain why you don’t.
What I find most amusing is your attempt to “blame it on el Niño.”
Do you see it? During El Niño, easterly trade winds diminish and the entire Pacific Ocean sloshes east, raising sea-level at San Diego, and lowering sea-level at Kwajalein. During La Niña and ENSO-neutral conditions, especially of long duration, the opposite happens.
So, let’s compare the measured sea-level plot to what Tamino did, in his effort to find evidence of acceleration. I’ve circled some of the El Niño peaks:
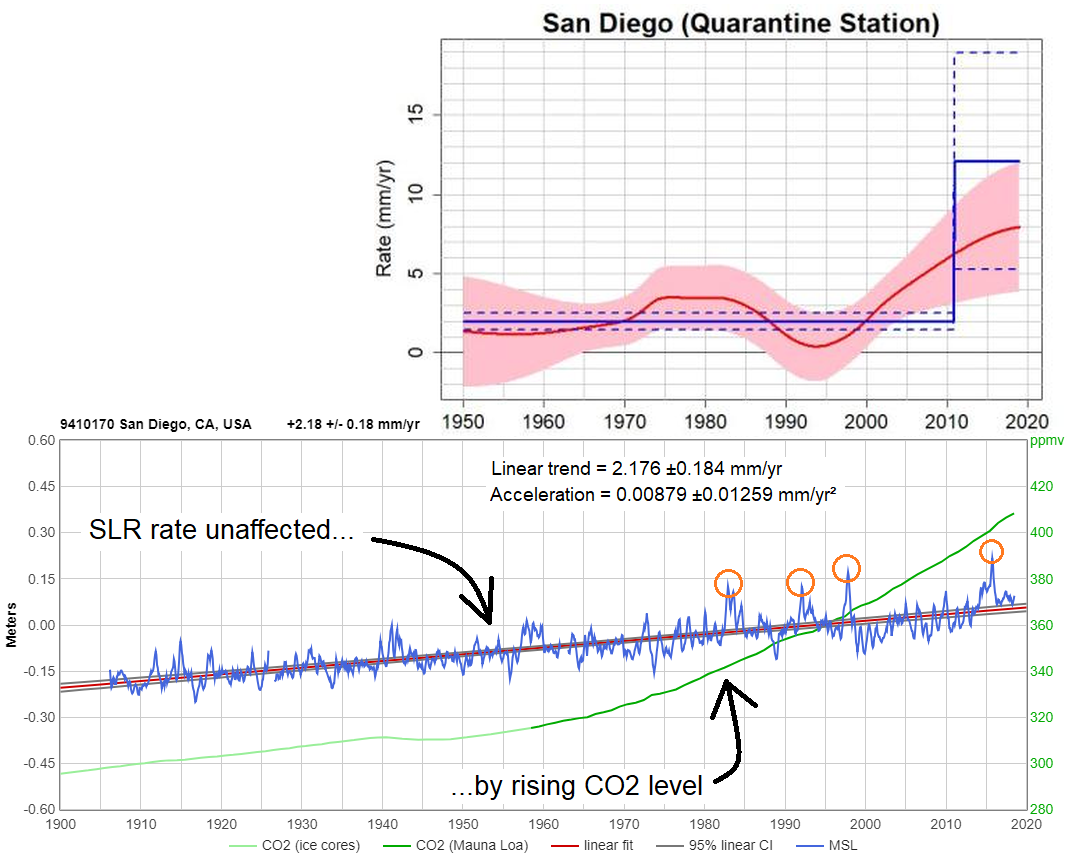
Do you see it? Tamino didn’t measure changes in long-term trend, he just measured ENSO slosh.
That big run-up at the end of his graph corresponds to the transition from the strong La Niña of 1999-2000, to the big 2015-16 El Niño.
No, Dave. “ENSO slosh” creates slosh. It doesn’t create trends. You also “circled some of the El Niño peaks,” but not all of them. Just the ones that you think makes your claim look realistic.
Certainly el Niño affects sea level at San Diego (and Kwajalein). You think it’s responsible for the trend change I found? If that’s true, then if I remove the influence of ENSO it should remove the trend change I found. Let’s find out.
I made my own model of the impact of el Niño. Here’s what it gives:

It’s not a perfect model but it’s pretty good. I removed this ENSO response from the original data, then tested the result for the acceleration I had found originally. It didn’t make the acceleration go away, it made the acceleration clearer and more obvious. Thanks to removing the noise induced by ENSO, the p-value is now below 0.0001. It is definitely, positively, statistically significant. Whether you like it or not.

Since you mentioned Kwajalein, I can estimate how ENSO affects its sea level too:

Then I can do the same, look for acceleration in the ENSO-adjusted data:

Lo and behold, there it is. Statistically significant. Both Kwajalein and San Diego show an increase in the rate of sea level rise, even though el Niño affects them in the opposite direction.
Here’s the rate estimated from the piecewise linear fit (solid blue line with dashed blue uncertainty range) and from a lowess smooth (solid red line with pink shade uncertainty range):

Blaming my result on el Niño doesn’t work. Taking it into account doesn’t make the statistical significance of acceleration go away, doesn’t even reduce it, it makes it a lot stronger.
Your original claim about tide gauge data not showing acceleration since the late 1920s, is the foundation of your denial of the sea level crisis. Your original claim is wrong. The tide gauge data show it. Using only quadratic fits to test for acceleration, ignores it.
Dave Burton: either accept the results of changepoint analysis and stop repeating that bullshit, or explain why you don’t.
tamino.wordpress.com |


