Waiting the weeks - What a mining transaction can look like
For Core Gold, the first stage of the bidding process was to have ended Nov. 1, 2019. Given that since then news has been held back since, it's pretty likely the company is weighing up and negotiating in detail, based on bids they received. It's extremely hard for investors to wait, but that is entirely appropriate.
It's just barely two weeks since the end of the open bidding process. Honestly, two weeks is a pretty short time. Nobody would want a shotgun wedding. Investors have been waiting 2 years, 5 years, even 12 years, to finally get to this point. After all the trials and tribulations, the extreme ups and downs, this is a very fine place to be.
We don't know what the process will look like. Right now there is a narrow price range in Core Gold stock trading, and only modest volume, less some days, more on others.
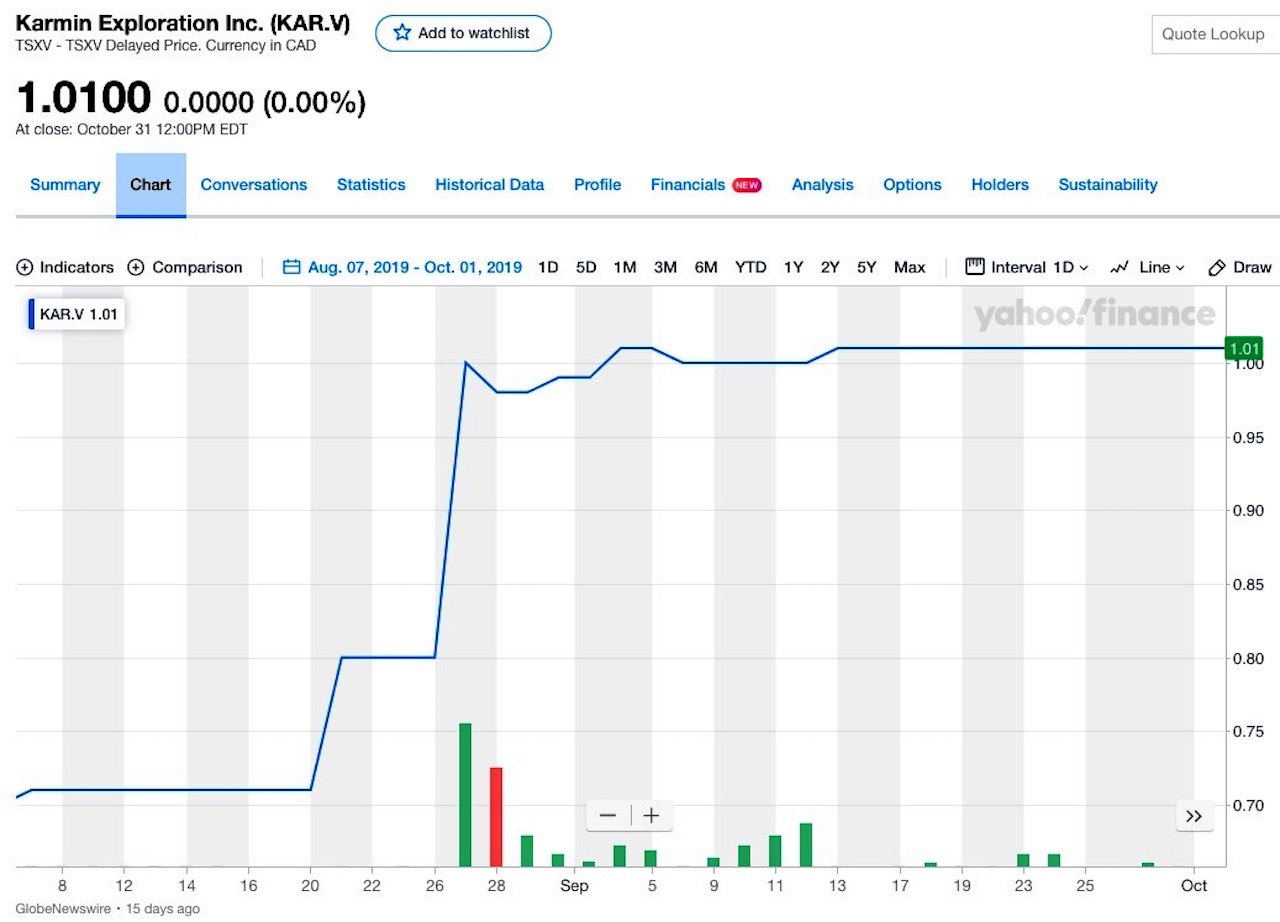
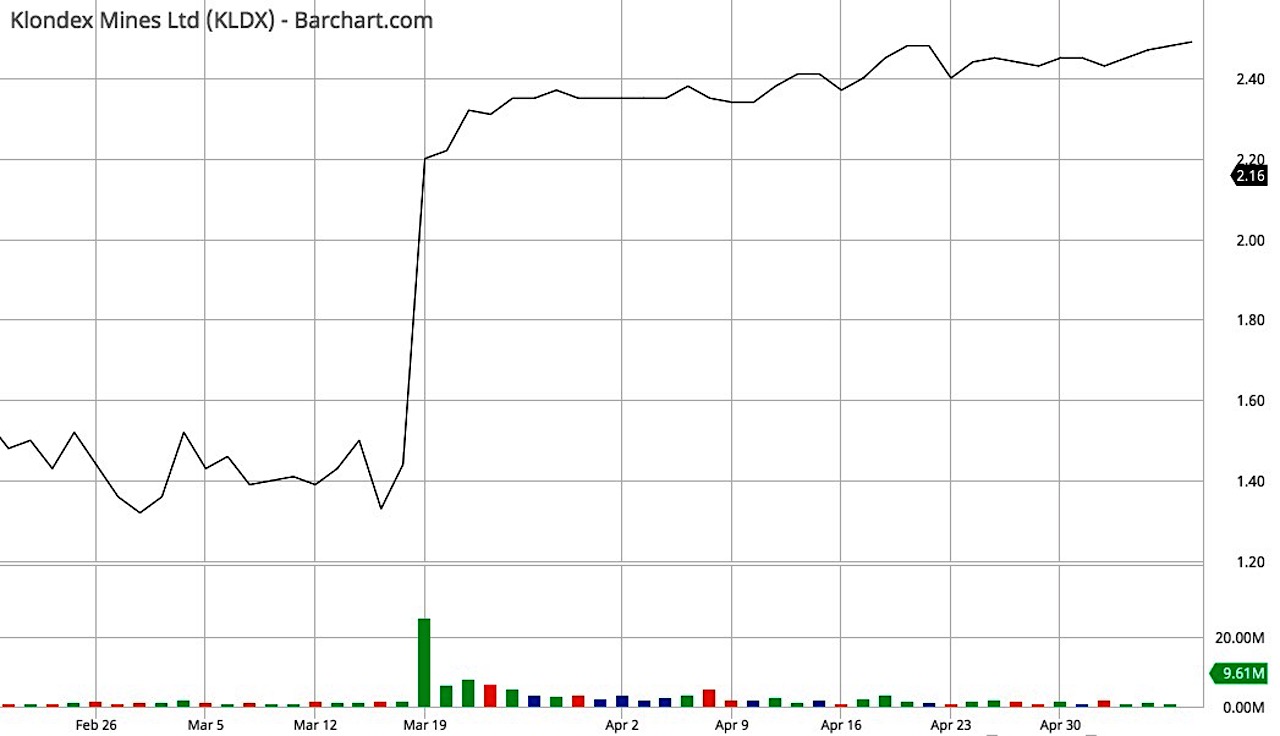
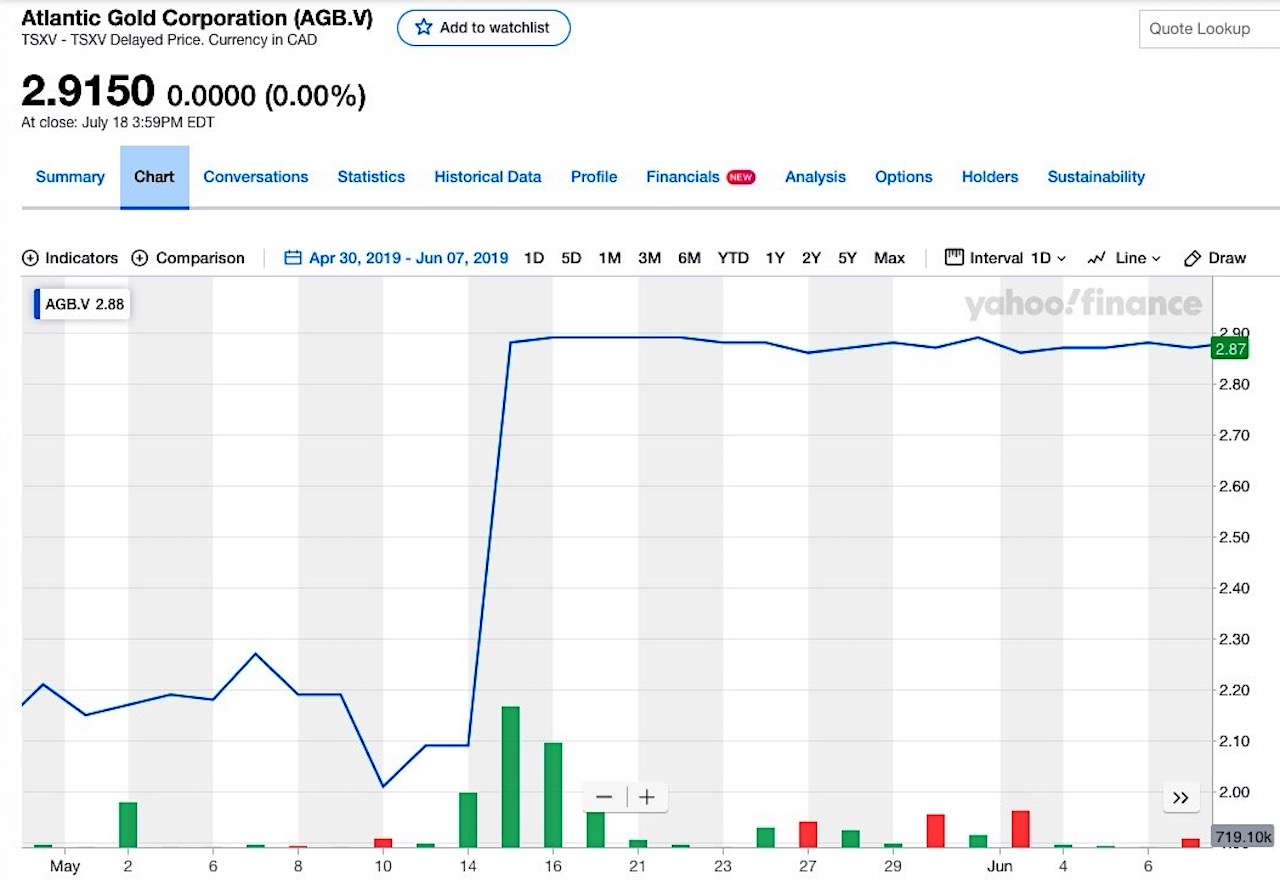
Here below are some comparison charts for other significant mining transactions. Each comparison chart starts about 3 weeks before a deal is announced. Of course, there is no guarantee that Core Gold's cart will look like these. I chose the three comparison charts at random.
The three weeks before a deal in each example chart seem to look like what we have now in Core Gold - a level phase, and no particular rise in volume before a deal is announced. Normally, without a transaction and during normal market activity, volume leads price. But takeovers and major transactions may not look like that. It tends to look like nothing is happening, and then a big bump up.
If our charts do compare - no guarantee - where Core Gold shareholders would be now, is at the left-hand side, at the beginning of each of the charts below. If so, I'm happy to wait a week or two or three, on the chance that Core Gold's chart ends up looking anything like typical.
August 26, 2019, Nexa Resources bought Karmin Exploration:
businesswire.com
March 19, 2018 Hecla Mining bought Klondex Mines:
globenewswire.com
May 14, 2019 St. Barbara bought Atlantic Gold Corp:
newswire.ca
 |


