| | | S&P 500’s Chart Signaling ‘Inflating Parabolic Bubble’

Richard Henry Suttmeier Contributor
FORBES
The S&P 500 is the first to become an “inflating parabolic bubble” on its weekly chart. This signal occurs when a stock or market has a 12x3x3 weekly slow stochastic reading above 90 on a scale of 00 to 100. Eventually the S&P will decline by 20% to 60% once the weekly chart turns negative.
Sure, the S&P 500 is above its quarterly and monthly pivots at 3,076.9 and 3,089.5, respectively, but the Dow is still below its quarterly risky level at 28.537 with the Nasdaq below its quarterly risky level at 8,591. This means that there remains some limited upside potential.
Be aware that the Dow Jones Transportation Average and Russell 2000 slipped last week. Transports is below its annual pivot at 10,976 with the small cap index below its quarterly pivot at 1,599.40. These two are below their all-time highs by 6.4% and 8.4%, respectively.
The Dow Jones Industrial Average set its all-time intraday high of 28,004.89 on November 15 with its quarterly risky level at 28,537.
The S&P 500 set its all-time intraday high of 3,120.46 on November 15 and is above its quarterly and monthly pivots at 3,076.9 and 3,089.5, respectively.
The Nasdaq Composite set its all-time intraday high of 8,540.83 on November 15, below its quarterly risky level at 8,591.
The Dow, S&P 500, Nasdaq, Dow Transports and Russell 2000 remain above their semiannual pivots at 27,266, 2,955.6, 7,999, 10.720 and 1,572.85, respectively.
The Dow, S&P 500 and Nasdaq remain above their annual pivots at 25,819, 2,867.1 and 7,370 Nasdaq, respectively. Transports and Russell 2000 remain straddle their annual pivots at 10,976 and 1,590.63.
All five major averages have positive weekly charts, and the Dow, S&P and Nasdaq are now overbought with the S&P 500 an inflating parabolic bubble.
Here’s Last Week’s Scorecard
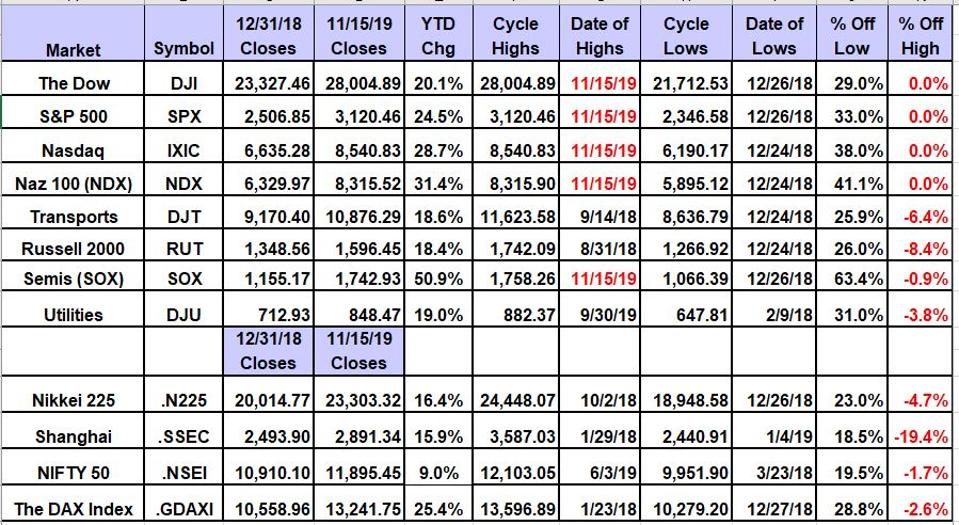
Scorecard For The Major Equity Averages
Global Market ConsultantsThe Dow Jones Industrial Average (28,004 on November 15) is up 29% from its December 26 intraday low of 21,712.53 and set its all-time intraday high of 28,004.89 on November 15. The weekly chart is positive but overbought with the average above its five-week modified moving average at 27,230 with its 12x3x3 weekly slow stochastic reading rising to 87.30 last week, up from 81.65 on November 8. This reading will rise above 90 this week making it an inflating parabolic bubble.
The S&P 500 (3,120 on November 15) is up 33% from its December 26 intraday low of 2,346.58 and set its all-time intraday high of 3,120.46 on November 17. The weekly chart is positive but overbought with the index above its five-week modified moving average at 3,035.12 with its 12x3x3 weekly slow stochastic reading rising to 91.11 last week, up from 86.97 on November 8 making it an inflating parabolic bubble.
Here’s the weekly chart for SPX
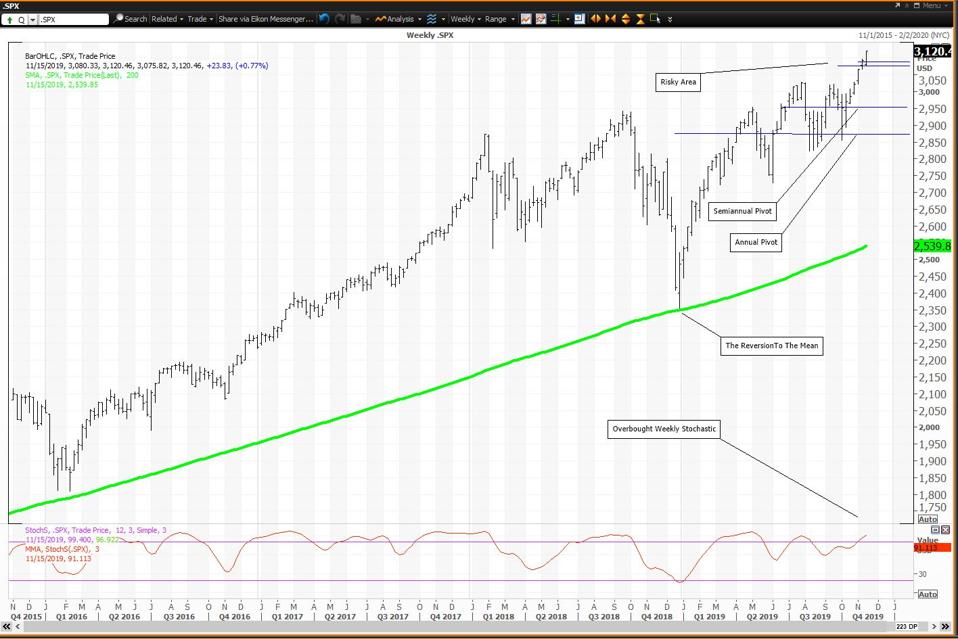
Weekly Chart For The S&P 500
RefinitivCourtesy of Refinitiv Xenith
The Nasdaq Composite (8,540.83 on November 15) is up 38% from its December 24 intraday low of 6,190.17 and set its all-time intraday high of 8,540.83 on November 15. The weekly chart is positive but overbought with the index above its five-week modified moving average at 8,273.74 with its 12x3x3 weekly slow stochastic reading rising to 86.60 last week, up from 80.08 on November 8.
The Dow Transportation Average (10,876 on November 15) is 25.9% above its December 24 intraday low of 8,636.79 and is 6.4% below its all-time intraday high of 11,623.58 set more than a year ago, on September 14, 2018. The weekly chart is positive with the average above its five-week modified moving average at 10,666 with its 12x3x3 weekly slow stochastic reading rising to 77.96 last week, up from 75.28 on November 8.
The Russell 2000 (1,596.45 on November 15) is 26% above its December 24 intraday low of 1,266.92 and is 8.4% below its all-time intraday high of 1,742.09 set more than a year ago on August 31, 2018. The weekly chart is positive with the index above its five-week modified moving average at 1,562.58 with its 12x3x3 weekly slow stochastic reading rising to 78.38 last week, up from 70.05 on November 8. |
|


