Bullish S&P 500 DeMark Signal Seen Only 5 Times Since 1982
Nov. 17, 2019 2:35 PMSPY, VTI, VOO
seekingalpha.com
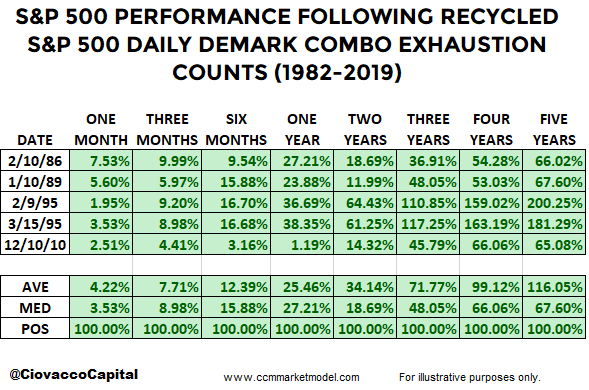
SummaryA recycled DeMark count appeared on the daily chart of the S&P 500 this week.Post contains table showing subsequent S&P 500 performance in the five previous cases (1982-2019).2019 is compared to several bearish periods in history, including 1929, 1974, and 1987.
Bullish Signal Appeared This WeekWhile there are some legitimate short-term concerns related to sentiment and market breadth, we also must consider the potential bullish implications of a series of extremely rare DeMark signals that have appeared on the daily chart of the S&P 500 ( SPY).
DeMark counts are proprietary tools from Market Studies, LLC that help identify possible trend exhaustion via a 9-13 count. In very rare instances, when trends and momentum are strong, DeMark counts are recycled. A recycled count is denoted by the blue R shown in the image below.
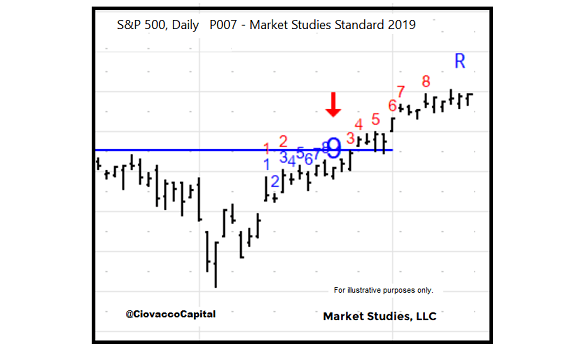
As of Thursday’s close, the daily DeMark Combo count is being recycled. If the recycled state remains in place, it would be helpful to know:
How many times has the S&P 500’s ( VOO) daily DeMark Combo count been recycled since 1982?
How did the stock market perform following the recycled counts?
Given a recycled count occurs in instances marked by strong trends and momentum, we would expect a recycled count to lean bullish from an odds perspective. There have been five previous periods that featured the same signal that is currently appearing on the daily chart of the S&P 500 ( IVV); in every case, stocks were higher looking out one month to five years.
DeMark has four major exhaustion counts, including the Combo count covered above. The other three major DeMark exhaustion counts were recycled in recent sessions as well.
How Does 2019 Compare To 1929 and 1987?This week’s CCM weekly stock market video covers other forms of evidence, including detailed comparisons to bearish periods in 1929, 1974, 1987, 2000, and 2007. This week’s video contains many important charts to help us fairly assess both sides of the bull/bear coin.

Day By DayThe recycled count, like any other bullish or bearish form of stock market ( VTI) evidence, speaks to odds. If the economic and technical facts shift in a meaningful manner in the coming days and weeks, we must be willing to reassess the odds of good things happening relative to bad things happening.
|


